and the distribution of digital products.
Top 5 Forex candlestick patterns every trader should know

For success in Forex, it is important to skillfully use various strategies and market analysis tools. Among them, candlestick patterns are among the most effective and versatile. These models are quite accurate and easy to use, so it is not surprising that they are particularly popular today. Let’s take a closer look at the top 5 Forex candlestick patterns that will be useful for every investor.
The importance of candlestick patterns in forex tradingThese models characterize the effects of trading activity over a certain period. Based on candlestick patterns, a trader can conclude price movements and possible trend reversals. The information content of this analysis tool is quite high. That is why candlestick patterns are so popular among traders. At the same time, their effectiveness increases significantly when used in combination with products from the Forex EA shop.
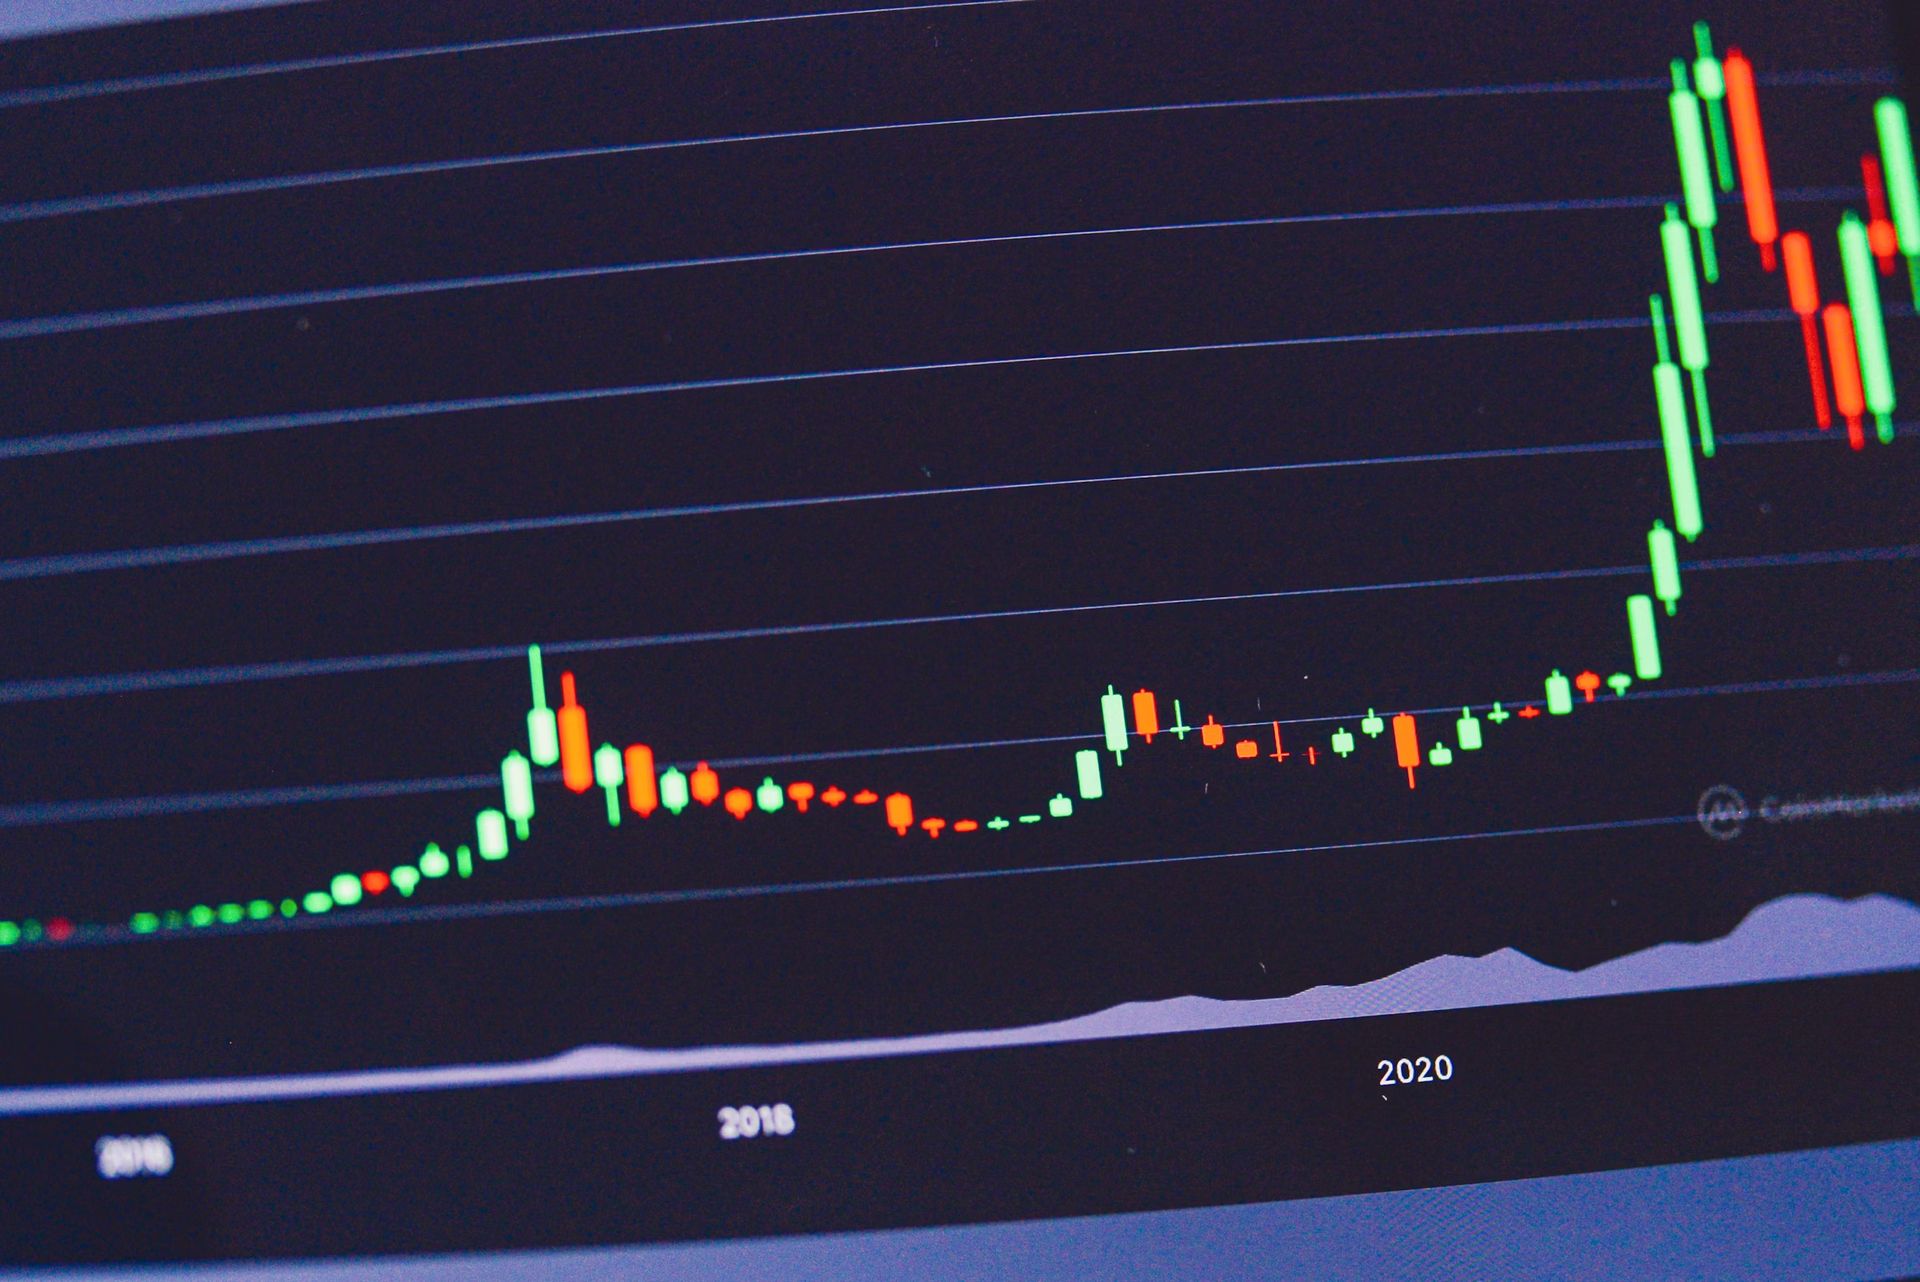
How to read candlestick patternsA chart indicates price changes. Each candlestick is a single bar. It shows the price of a specific asset over a certain period. A pattern can consist of one candle or several. It all depends on the market conditions analyzed by the trader.
The candlestick pattern is quite simple to use. After the corresponding chart appears and is confirmed, a trader simply needs to open a buy or sell trade.
Top 5 Forex candlestick patternsAnalyzing candlestick models is a critical skill for successful trading. The peculiarities of candlestick chart formation help to predict market behavior quite accurately. The most effective and, accordingly, popular patterns are described further.
DojiThis chart formation can occur under different conditions, for example:
- At the top of an uptrend;
- At the bottom of a downtrend;
- In the middle of an existing trend.
The Doji pattern has a small body. It is located in the middle of the chart, between the long upper and lower shadows. This pattern indicates indecision in the market. If you notice it, you should expect an approaching reversal of the current trend.
Hammer and Hanging ManThe Hammer model is characterized by a long shadow at the bottom. It is usually at least twice as long as the body of this candlestick pattern. The figure is formed at the lowest point of a downtrend. It indicates market weakness.
As for the Hanging Man, this pattern is a trend reversal formation at the top. It warns that the price cannot break through because of strong resistance. The bulls are exhausted and are unable to raise the price any further. The Hanging Man pattern has a small body and a long lower shadow. The formation of the Hammer and Hanging Man patterns can be observed in different trends. The Hammer most often appears when the price is falling, and the Hanging Man — when it is rising.
Engulfing patternThere is a bullish and a bearish engulfing pattern. These two candlestick formations are based on two opposite candlestick patterns that mirror each other. The Bullish Engulfing shows that the bulls are gaining the upper hand over the bears. The Bearish Engulfing pattern is most often formed at the top of an uptrend when the bears prevail in the market.
Harami patternThis chart is a reversal formation. Its name means “pregnant” in Japanese. This is because the shape of the chart is somewhat similar to that of a pregnant woman. The pattern appears at the peak of an uptrend or the end of a downtrend.
The Harami model consists of two candlesticks. The first one is a continuation of the current trend and is larger than the second one, which is in the range of the first candle’s body. When the Bullish Harami high is broken, a signal appears that indicates entry into a long position. The breakout of the Bearish Harami low tells the trader about the right moment to open a sell order.
Morning Star and Evening StarThe Morning Star pattern consists of three bullish and bearish candlesticks. The first one is a long, bearish candle. Then, after a gap, a second short candlestick appears. The last component of the formation is a long, bullish one. This chart indicates rapid market growth when, initially, the trades are controlled by sellers. Then, they lose control, and after a while, the trend turns bullish.
The Evening Star Pattern is a mirror image of the previous chart. Three growing candlesticks form this figure. The first one is still controlled by buyers. The body of the candlestick is quite large. The second element of the pattern becomes smaller, and the bulls lose control of the market. The third candle in the Evening Star pattern is bearish. It signals that the market is under the influence of sellers.
It is difficult to overestimate the importance of analyzing candlestick patterns, as such models allow traders to predict market behavior quite accurately. This, in turn, helps build the most effective strategies for working on Forex, which significantly increases investor profits and helps minimize risks.
Featured image credit: rc.xyz NFT gallery/Unsplash
- Home
- About Us
- Write For Us / Submit Content
- Advertising And Affiliates
- Feeds And Syndication
- Contact Us
- Login
- Privacy
All Rights Reserved. Copyright , Central Coast Communications, Inc.