and the distribution of digital products.
DM Television
SOLNA IS IN LINE TO BREAK $300 LEVEL: CAN IT DIP FIRST?
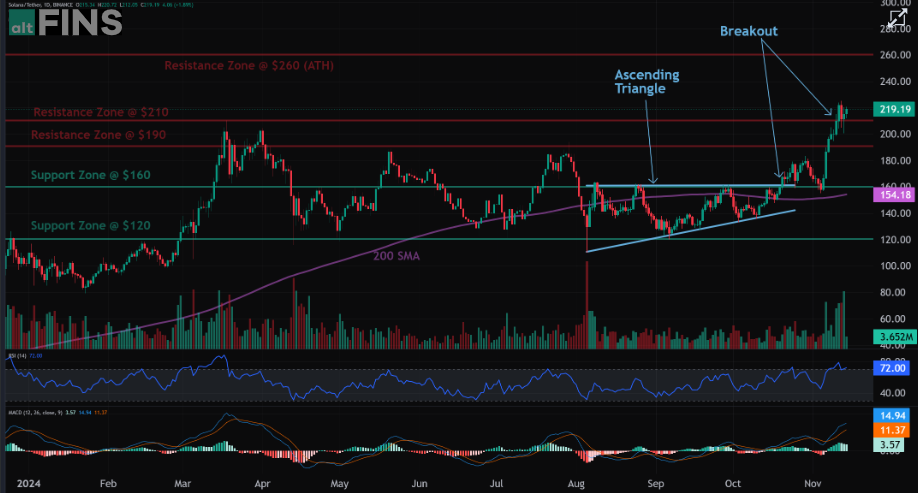
Solana is trading above $200 level and is in line to break it’s all time high level of $260 and could break $300 level.
Resistance Breakout. Once a price breaks above a resistance zone, it signals that buyers have absorbed all the supply from sellers at this level and price can resume it’s advance. Following a resistance breakout, the next closest resistance zone becomes a price target.
For on-demand analysis of any cryptocurrency, join our Telegram channel.
Solana Price Target- Price: $216.78
- Market Cap: $102.32 billion
- 24h Trading Volume: $11.08 billion
- Circulating Supply: 471.99 million SOL
- Total Supply: 588.34 million SOL
 Img src- Altfins
Following a breakout from Ascending Triangle, above the triangle resistance of $160, price has rallied above $210 for +30% gain. That’s a 52-week high. Next, it could revisit ATH at $260.
Price is now overbought (RSI > 70), hence, near-term, we could see it pause here on some profit taking. We would patiently wait for a pullback opportunity to $190 for a swing trade entry in Uptrend.
Buy Now Weekly Price AnalysisOver the past week, SOL saw a notable increase from $186.06 to a high of $225.30.
Trend: Short-term trend is Strong Up, Medium-term trend is Strong Up, Long-term trend is Strong Up.
Momentum is Bullish but inflecting. MACD Line is still above MACD Signal Line but momentum may have peaked since MACD Histogram bars are declining, which suggests that momentum could be nearing a downswing. Price is Overbought currently.
Support and Resistance: Nearest Support Zone is $160.00, then $120.00. Nearest Resistance Zone is $260.00.
Technical Indicators- Relative Strength Index (RSI): Remains in a bullish range and overbought range.
- Moving Averages (MA): 50-day MA is trending upward, suggesting sustained interest.
- MACD: Positive crossover indicates bullish sentiment may persist in the near term.
- Market Momentum: Post-U.S. election, crypto markets are experiencing renewed optimism, which has positively influenced SOL.
- Solana ETFs: Canary Capital has filed for a Solana ETF, which could drive further institutional investment
For on-demand analysis of any cryptocurrency, join our Telegram channel.
- Home
- About Us
- Write For Us / Submit Content
- Advertising And Affiliates
- Feeds And Syndication
- Contact Us
- Login
- Privacy
All Rights Reserved. Copyright , Central Coast Communications, Inc.