and the distribution of digital products.
Social media benchmarks: Q1 2025 data + tips
How do you know the “right” number of engagements to expect on your social posts? Is 100 likes a lot or a little? The answer is, it depends.
That’s where social media benchmarks come in. This industry-specific data tracks the norms or averages for specific metrics like social media engagement and follower growth. It gives you an understanding of how businesses similar to yours are doing — and a better sense of what those 100 likes really mean.
Keep reading to learn more about the process of social media benchmarking. This post includes up-to-date (Q4 2024) benchmarks for key industries to help you understand how your social results stack up right now.
Get a free, customizable competitive analysis template to easily size up the competition and identify opportunities for your brand to pull ahead.
Download now What is a social media benchmark?A social media benchmark is an average result that serves as a standard by which other businesses in the same industry or category can be measured or judged. The benchmark is essentially the norm for social media marketing success. Think of it as the level of social media performance all businesses within a category should try to reach or exceed.
Social media benchmarks are important because they provide context for your social media KPIs. There’s always value to tracking your own social media metrics and growth over time, even in isolation. But when you place that data in the context of the larger industry picture, you can better understand where there are real opportunities for improvement.
You can also use benchmarks to set realistic goals expectations. Some industries (like entertainment) will by nature have greater reach than others (like health care). When you know what’s “normal” for your industry, you can set reasonable milestones that allow you to achieve real growth without burning out your social team.
 #1 Social media tool
Create. Schedule. Publish. Engage. Measure. Win.
Free 30-day trial How to find social media benchmarksManually compiling reliable social media benchmarks by industry can involve a lot of very finicky and frustrating research.
Fortunately, Hootsuite Analytics has a built-in social media benchmarking tool that allows you to compare the performance of your social accounts against the average of brands in your industry with just a couple of clicks.
To access this new feature, head to Analytics within your Hootsuite dashboard. Under Benchmarking in the the left menu, click Industry, then click Select your industry and choose the most relevant option from the drop-down menu.
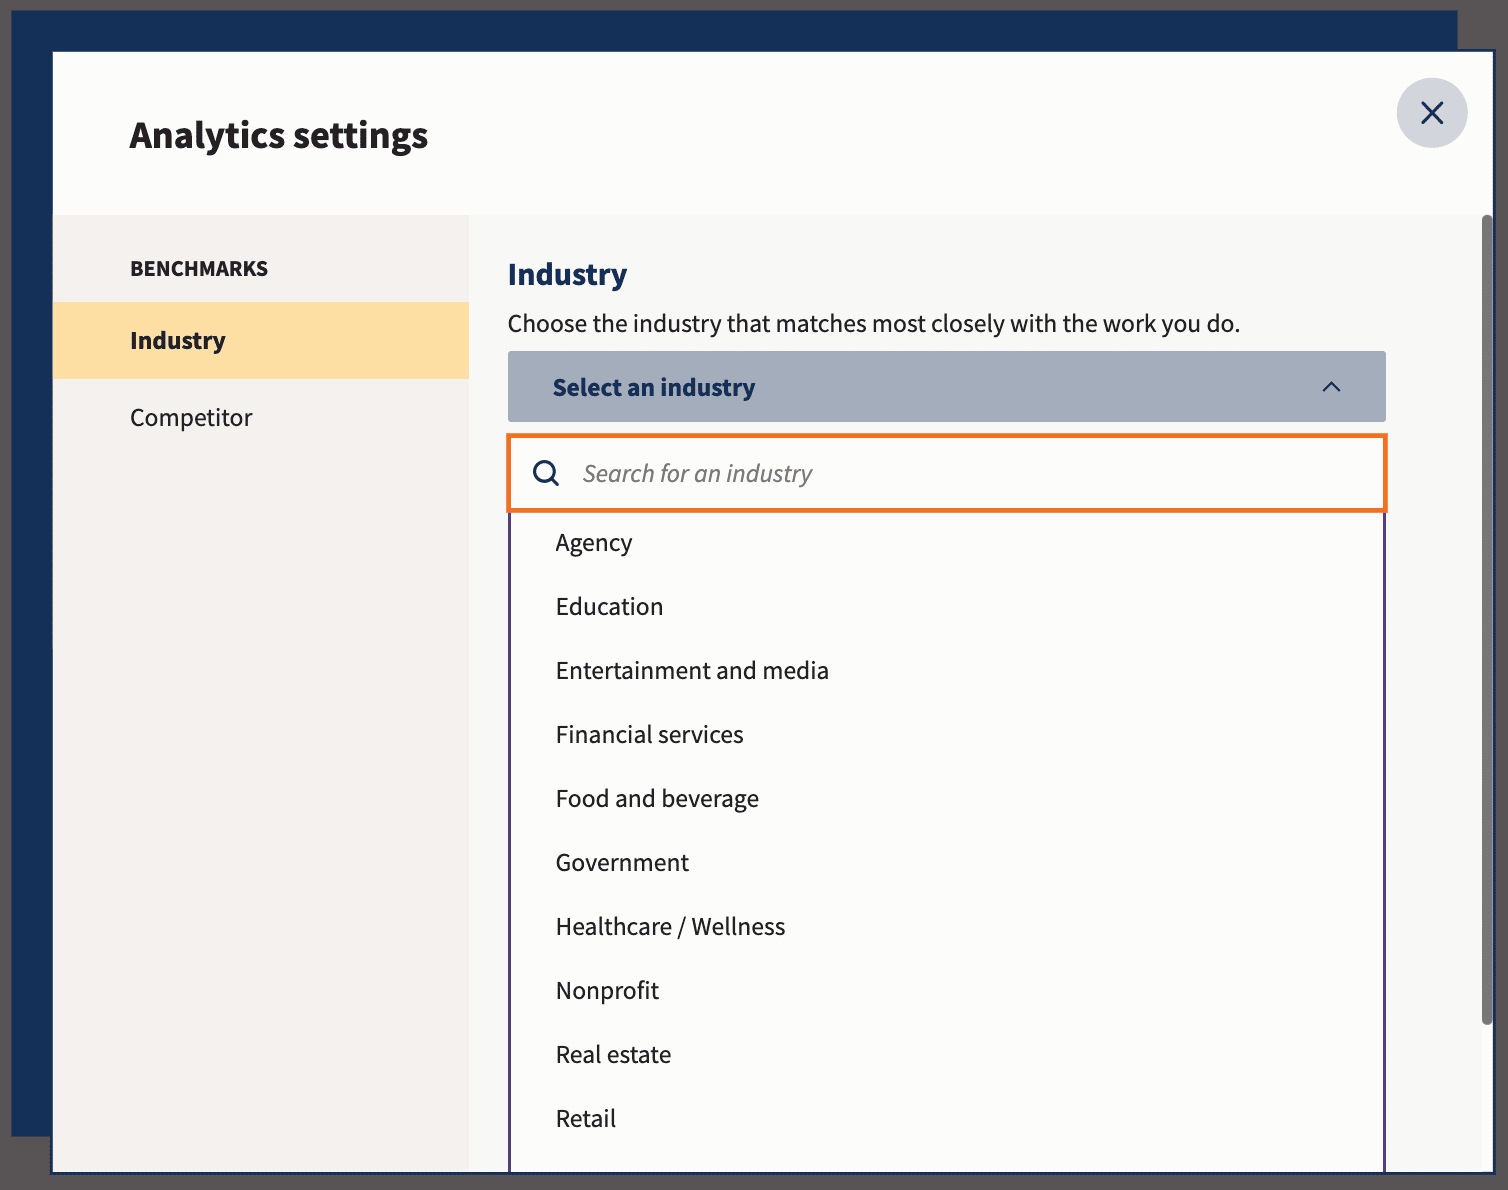
Now you can see how your results compare to average performance stats within your industry. You can set up custom timeframes, switch between networks — Instagram, Facebook, X (Twitter), LinkedIn, and TikTok — and look up benchmarks for the following metrics:
- Profile impressions
- Profile reach
- Followers
- Audience growth rate
- Engagement rate
- Video plays
- Posting frequency
- Clicks
- Shares
… and more.
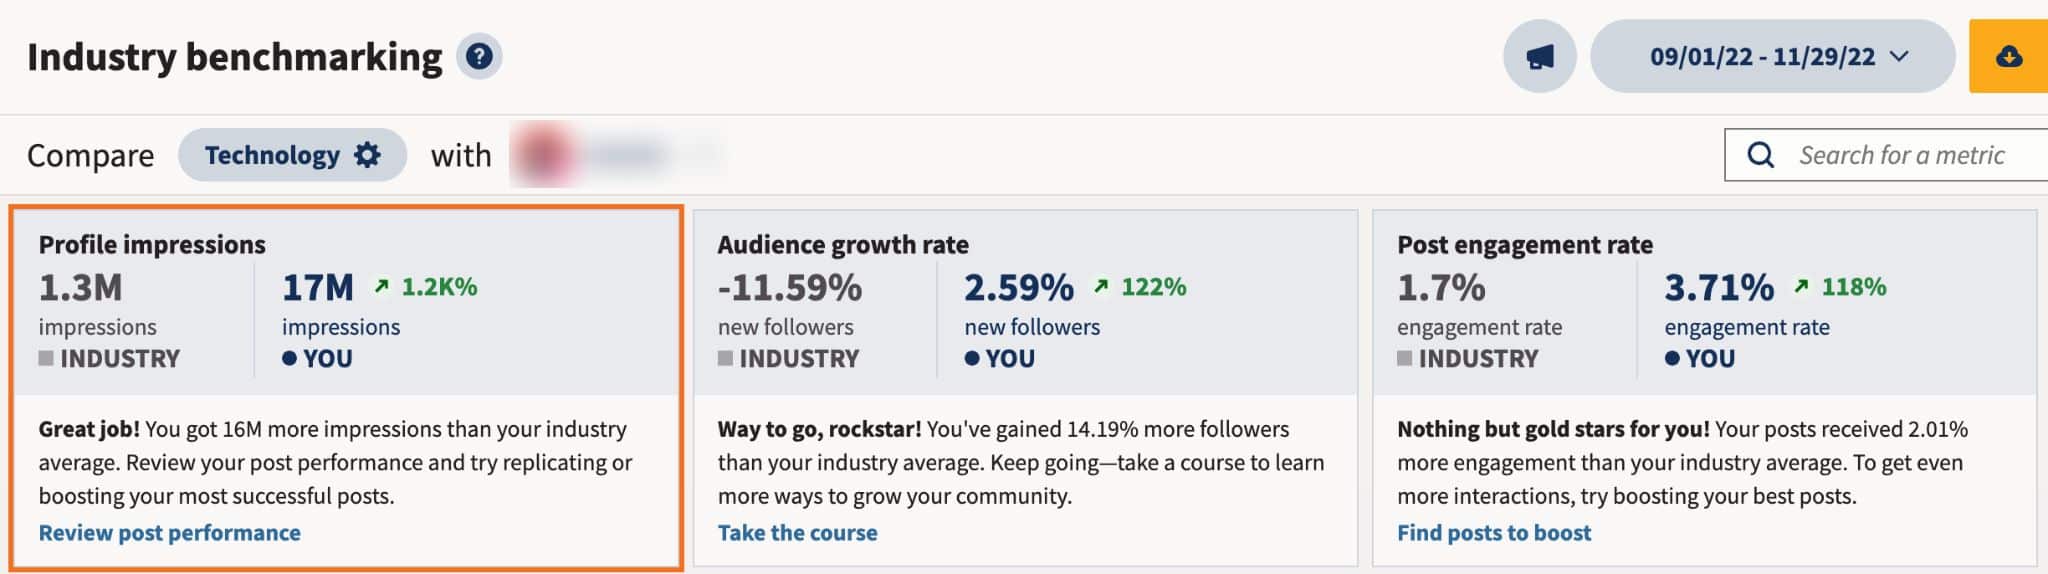
You will also find resources to improve your performance right in the summary section:
And, if you need to present your results to your team, boss, or other stakeholders, you can easily download your comparison report as a PDF file.
Q4 2024 social media benchmarks by industry Social media benchmarks in education Best content type to post on FacebookIn the education industry, albums perform best on Facebook at 7.1%.
 Best content type to post on Instagram
In the education industry, carousels perform best on Instagram at 6.5%, offering an interactive way for users to view educational content.
 Best content type to post on LinkedIn
In the education industry, photos perform best on LinkedIn at 1.8%, providing a visually appealing way to view educational content.
 Follower growth rate in education
If your social media strategy revolves around growing your audience, make sure you’re setting realistic goals.
On Facebook, educational institutions saw 0.48% weekly follower growth in Q4 2024.
 How often should you post on social media in the education industry?
Our research found that the education industry posts on Facebook an average of 4 times a week.
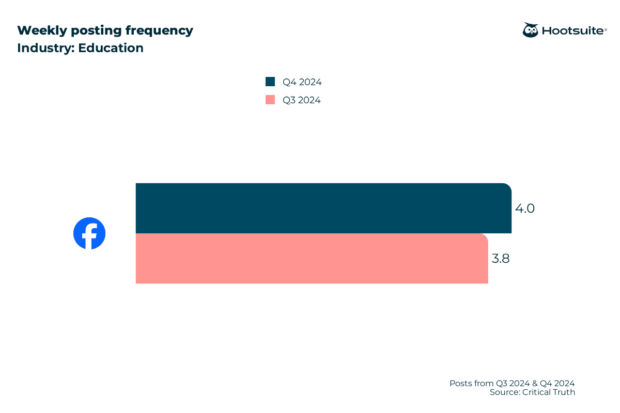
Below, you’ll find network-specific data that illustrates how posting frequency corresponds to overall engagement rates.

On Facebook, performance depends more on the content you post than on how often you post. However, institutions that posted three times saw a higher engagement rate of 2.86%.
Weekly frequency and engagement rates in education on InstagramIn the education industry on Instagram, the highest engagement rate of 5.6% is achieved with a weekly posting frequency of 5 posts.
 Weekly frequency and engagement rates in education on LinkedIn
In the education industry on LinkedIn, the highest engagement rate of 2.3% is achieved with a weekly posting frequency of 9 posts.
 Weekly frequency and engagement rates in education on X (Twitter)
In the education industry on X (Twitter), the highest engagement rate of 4.0% is achieved with a weekly posting frequency of 1 post.

For more education-specific benchmarks, including the best times to post, the most engaging content formats, and stats for more major social networks, check out our dedicated post on social media benchmarks for education.
Social media benchmarks in entertainment and media Best content type to post on FacebookIn the entertainment and media industry, albums perform best on Facebook at 1.7%, providing its audience with organized content.
 Best content type to post on Instagram
In the entertainment and media industry, photos and reels perform equally well on Instagram at 2.0%.
 Best content type to post on LinkedIn
In the entertainment and media industry, the best content type on LinkedIn is videos, with the highest engagement of 2.3%.
 Follower growth rate in entertainment and media
Instagram has the highest weekly follower growth rate, at 0.57%, which shows that it’s a great place to grow your network in entertainment and media.
Here is how other entertainment and media profiles are doing in Q4 2024:
- LinkedIn: 0.47%
- Instagram: 0.57%
- X (Twitter): 0.46%
 How often should you post on social media in the entertainment and media industry?
Our research found that the entertainment and media industry posts on X (Twitter) the most, 193 times weekly, which is more often than on other social platforms.
 Weekly frequency and engagement rates in entertainment and media on Facebook
In the entertainment and media industry on Facebook, the highest engagement rate of 1.50% is achieved with a weekly posting frequency of 11 posts.
 Weekly frequency and engagement rates in entertainment and media on Instagram
In the entertainment and media industry on Instagram, the highest engagement rate of 2.75% is achieved with a weekly posting frequency of 7 posts.
 Weekly frequency and engagement rates in entertainment and media on LinkedIn
In the entertainment and media industry on LinkedIn, the highest engagement rate of 3.0% is achieved with a weekly posting frequency of 1 post.
 Weekly frequency and engagement rates in entertainment and media on X (Twitter)
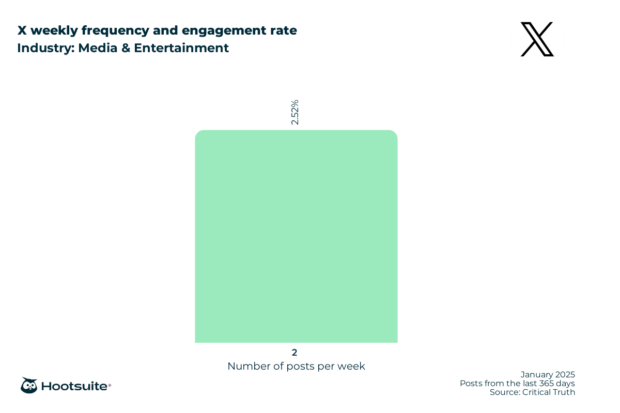
In the entertainment and media industry on X (Twitter), the highest engagement rate of 2.52% is achieved with a weekly posting frequency of 2 posts.
 Social media benchmarks in financial services
Best content type to post on Facebook
Social media benchmarks in financial services
Best content type to post on Facebook
In the financial services industry, albums perform best on Facebook at 4.9%.
 Best content type to post on Instagram
In the financial services industry, carousels and photos perform best on Instagram at 5.0%.
 Best content type to post on LinkedIn
In the financial services industry, photos perform best on LinkedIn at 2.6%, providing a visually appealing way to view content.
 Follower growth rate in financial services
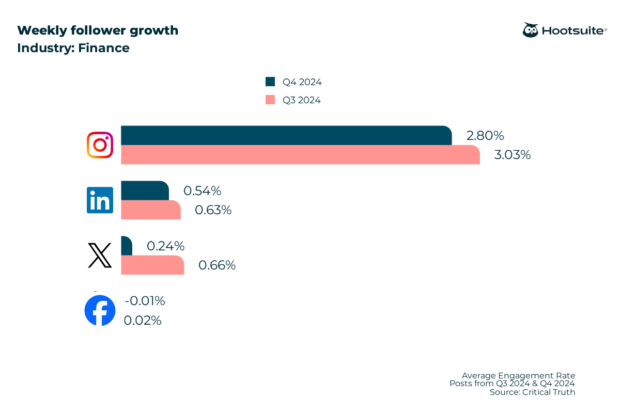
Instagram has the highest weekly follower growth rate at 2.80%, showing it’s a great place to grow your network in financial services.
Here is how other financial service profiles are doing in Q4 2024:
- LinkedIn: 0.54%
- Instagram: 2.80%
- X (Twitter): 0.24%
- Facebook: -0.01%
 How often should you post on social media in financial services?
Our research found that financial services post the most on Instagram with 5 posts a week.
 Follower growth rate in financial services
If your social media strategy revolves around growing your audience, make sure you’re setting realistic goals. Here is how other FinServ profiles did in Q4 2024:
- Instagram: 2.8%
- LinkedIn: 0.54%
- X (Twitter): 0.24%
- Facebook: -0.01%
 Weekly frequency and engagement rates in financial services on Facebook
In financial services on Facebook, the highest engagement rate of 1.56% is achieved with a weekly posting frequency of 7 posts.
 Weekly frequency and engagement rates in financial services on Instagram
In the financial services on Instagram, the highest engagement rate of 2.08% is achieved with a weekly posting frequency of 4 posts.
 Weekly frequency and engagement rates in financial services on LinkedIn
In the financial services on LinkedIn, the highest engagement rate of 3.08% is achieved with a weekly posting frequency of 7 posts.
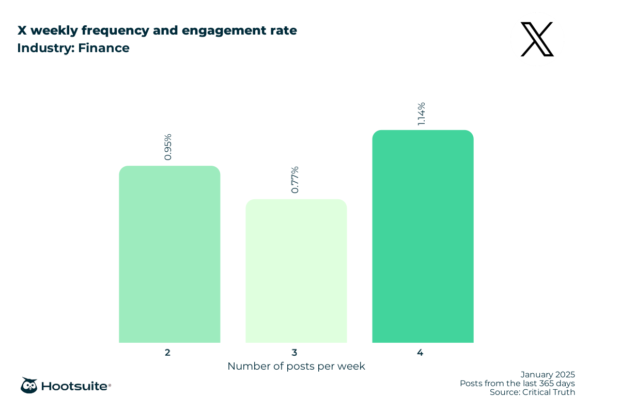
 Weekly frequency and engagement rates in financial services on X (Twitter)
In the financial services on X (Twitter), the highest engagement rate of 1.14% is achieved with a weekly posting frequency of 4 posts.
Check out our dedicated post on social media benchmarks for FinServ for more stats, including the best times to post and the most engaging content formats.
Social media benchmarks in dining, hospitality, and tourism Best content type to post on FacebookIn the dining, hospitality, and tourism industry, albums perform best on Facebook at 3.5%
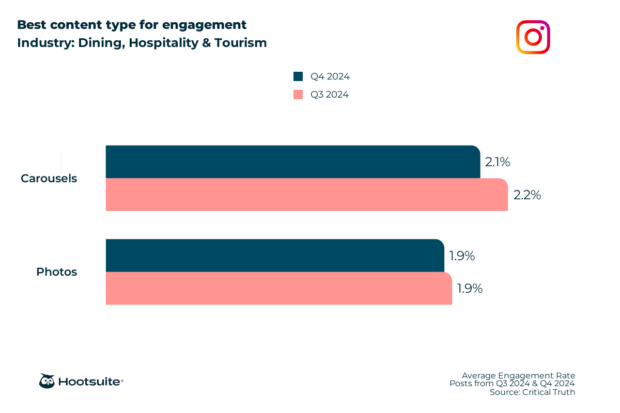
 Best content type to post on Instagram
In the dining, hospitality, and tourism industry, carousels perform best on Instagram at 2.1%.
 Follower growth rate in dining, hospitality, and tourism
LinkedIn has the highest weekly follower growth rate at 1.58%, showing it’s a great place to grow your network in dining, hospitality, and tourism.
Here is how other dining, hospitality, and tourism profiles are doing in Q4 2024:
- LinkedIn: 0.57%
- Instagram: 1.52%
 How often should you post on social media in the dining, hospitality, and tourism industry?
Our research found that the dining, hospitality, and tourism industry posts on Facebook and Instagram more often than on other social platforms, with 6.8 posts on Facebook and 3.3 posts on Instagram weekly.
 Weekly frequency and engagement rates in dining, hospitality, and tourism on Facebook
In the dining, hospitality, and tourism industry on Facebook, the highest engagement rate of 0.97% is achieved with a weekly posting frequency of 13 posts.
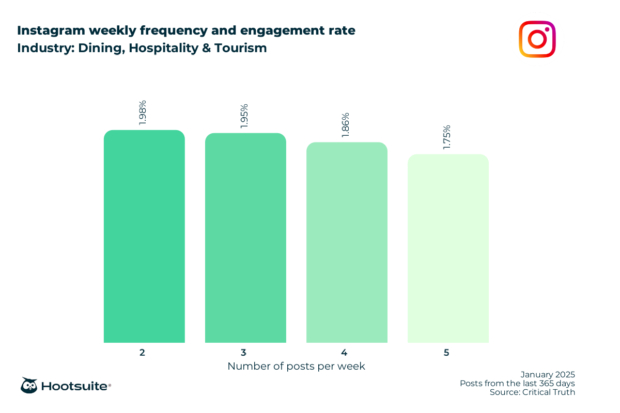
 Weekly frequency and engagement rates in dining, hospitality, and tourism on Instagram
In the dining, hospitality, and tourism industry on Instagram, the highest engagement rate of 1.98% is achieved with a weekly posting frequency of 2 posts.
 Social media benchmarks in government
Best content type to post on Facebook
Social media benchmarks in government
Best content type to post on Facebook
In government-related services, albums and links perform equally well on Facebook at 2.4%
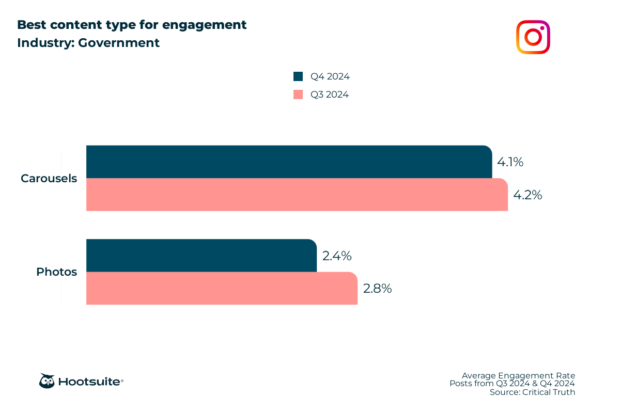
 Best content type to post on Instagram
In government-related services, carousels perform best on Instagram at 4.1%
 Best content type to post on LinkedIn
In government-related services, photos perform best on LinkedIn at 3.6%.
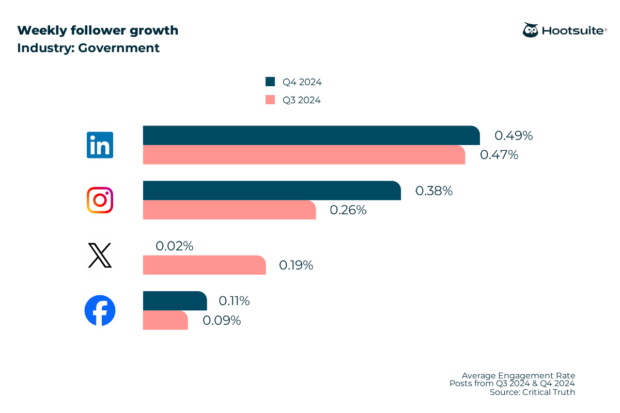
 Follower growth rate in government-related services
LinkedIn has the highest weekly follower growth rate at 0.49%, showing it’s a great place to grow your network in government-related services.
Here is how other government profiles are doing in Q4 2024:
- LinkedIn: 0.49%
- Instagram: 0.38%
- X (Twitter): 0.02%
- Facebook: 0.11%
 How often should you post on social media for government-related services?
Our research found that government-related services post on Facebook more often than on other social platforms—an average of 8.7 times a week.
 Weekly frequency and engagement rates in government-related services on Facebook
For government-related services on Facebook, the highest engagement rate of 2.13% is achieved with a weekly posting frequency of 6 posts.
 Weekly frequency and engagement rates in government-related services on LinkedIn
For government-related services on LinkedIn, the highest engagement rate of 3.80% is achieved with a weekly posting frequency of 7 posts.
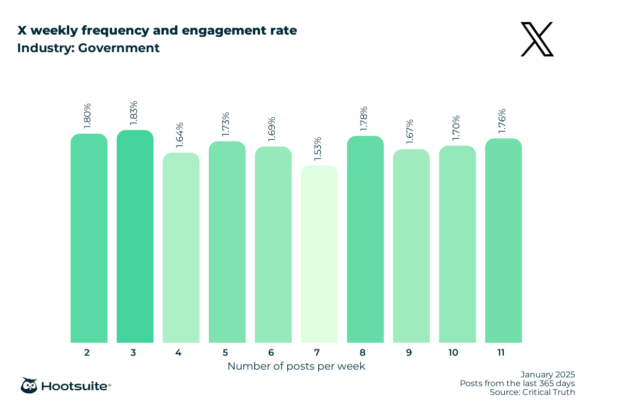
 Weekly frequency and engagement rates in government-related services on X (Twitter)
For government-related services on X (Twitter), the highest engagement rate of 1.83% is achieved with a weekly posting frequency of 3 posts.
 Social media benchmarks in healthcare
Best content type to post on Facebook
Social media benchmarks in healthcare
Best content type to post on Facebook
In the healthcare industry, albums perform best on Facebook at 14.8%
 Best content type to post on Instagram
In the healthcare industry, carousels perform best on Instagram at 5.0%.
 Best content type to post on LinkedIn
In the healthcare industry, photos perform best on LinkedIn at 2.2%.
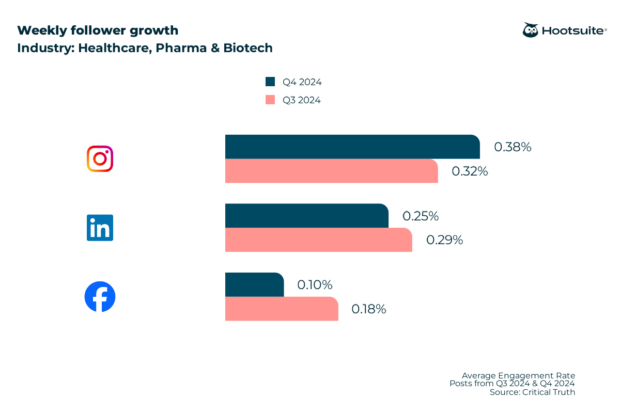
 Follower growth rate in healthcare
Instagram has the highest weekly follower growth rate at 0.38%, showing it’s a great place to grow your network in healthcare.
Here is how other healthcare profiles are doing in Q4 2024:
- LinkedIn: 0.25%
- Instagram: 0.38%
- Facebook: 0.10%
 How often should you post on social media in the healthcare industry?
Our research found that the healthcare industry posts on Instagram more often than on other social platforms — an average of 4.7 times a week.
 Weekly frequency and engagement rates in healthcare on Facebook
In the healthcare industry on Facebook, the highest engagement rate of 1.34% is achieved with a weekly posting frequency of 3 posts.
 Weekly frequency and engagement rates in healthcare on Instagram
In the healthcare industry on Instagram, the highest engagement rate of 1.77% is achieved with a weekly posting frequency of 2 posts.
 Weekly frequency and engagement rates in healthcare on LinkedIn
In the healthcare industry on LinkedIn, the highest engagement rate of 2.97% is achieved with a weekly posting frequency of 6 posts.
 Weekly frequency and engagement rates in healthcare on X (Twitter)
In the healthcare industry on X (Twitter), the highest engagement rate of 1.30% is achieved with a weekly posting frequency of 4-5 posts.

For more healthcare-specific research, including the best times to post, the most engaging content formats, and stats for more major networks, check out our dedicated post on healthcare social media benchmarks.
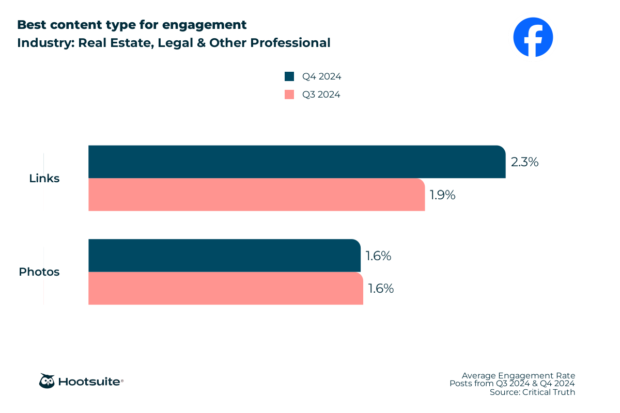
Social media benchmarks in real estate, legal, and other professional Best content type to post on FacebookIn the real estate, legal, and other professional industries, links perform best on Facebook at 2.3%
 Best content type to post on Instagram
In the real estate, legal, and other professional industries, carousels perform best on Instagram at 6.6%.
 Best content type to post on LinkedIn
In the real estate, legal, and other professional industries, photos perform best on LinkedIn at 2.8%.
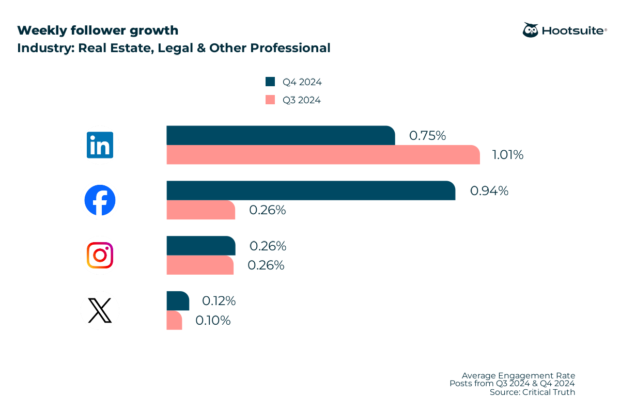
 Follower growth rate in real estate, legal, and other professional industries
Facebook has the highest weekly follower growth rate at 0.94%, showing it’s a great place to grow your network in the real estate, legal and other professional industries.
Here is how other professional profiles are doing in Q4 2024:
- LinkedIn: 0.75%
- Instagram: 0.26%
- X (Twitter): 0.12%
- Facebook: 0.94%
 How often should you post on social media in the real estate, legal, and other professional industries?
Our research found that the professional industry posts on X (Twitter) more often than on other social platforms — an average of 12.6 times a week. LinkedIn follows with 11.1 posts a week.
 Weekly frequency and engagement rates in the real estate, legal, and other professional industries on Facebook
In the real estate, legal, and other professional industries on Facebook, the highest engagement rate of 1.91% is achieved with a weekly posting frequency of 9 posts.
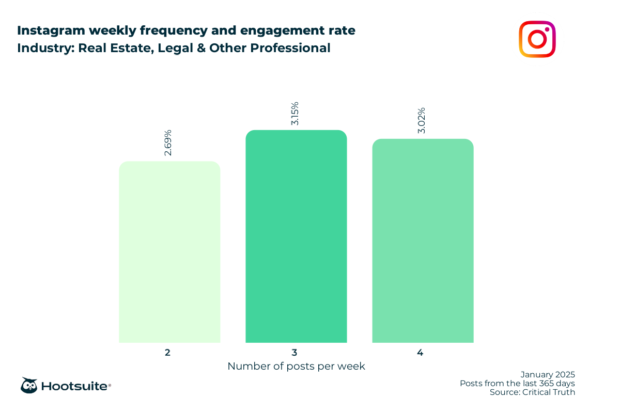
 Weekly frequency and engagement rates in the real estate, legal, and other professional industries on Instagram
In the real estate, legal, and other professional industries on Instagram, the highest engagement rate of 3.15% is achieved with a weekly posting frequency of 3 posts.
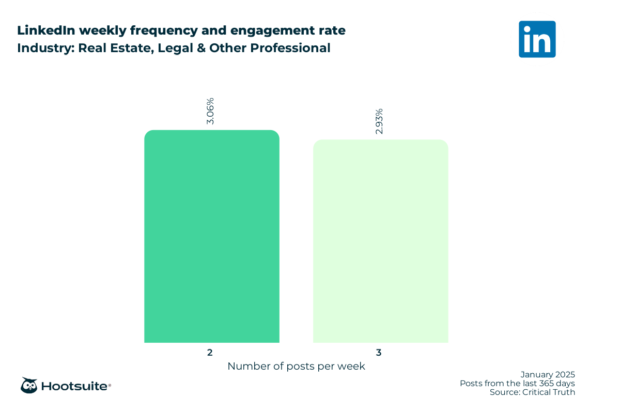
 Weekly frequency and engagement rates in the real estate, legal, and other professional industries on LinkedIn
In the real estate, legal, and other professional industries on LinkedIn, the highest engagement rate of 3.06% is achieved with a weekly posting frequency of 2 posts.
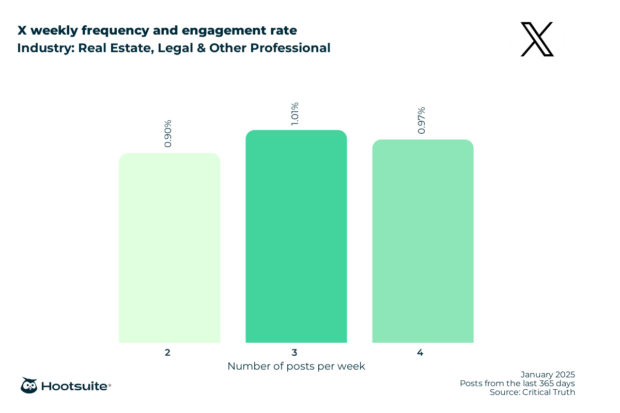
 Weekly frequency and engagement rates in real estate on X (Twitter)
In the real estate industry on X (Twitter), the highest engagement rate of 1.01% is achieved with a weekly posting frequency of 3 posts.
 Social media benchmarks in retail
Best content type to post on Facebook
Social media benchmarks in retail
Best content type to post on Facebook
In the retail industry, videos perform best on Facebook at 1.7%.
 Best content type to post on Instagram
In the retail industry, Reels perform best on Instagram at 2.1%.
 Best content type to post on LinkedIn
In the retail industry, videos perform best on LinkedIn at 3.3%.
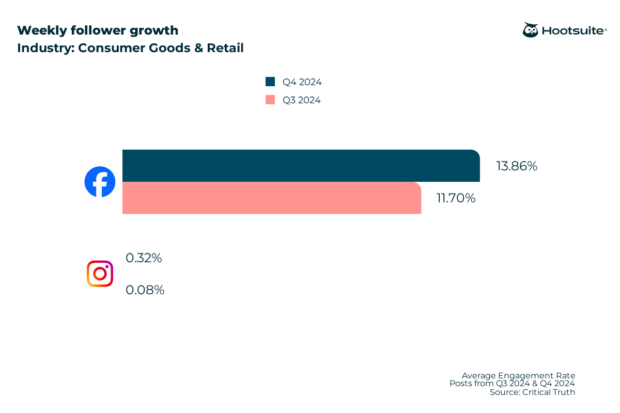
 Follower growth rate in retail
Facebook has the highest weekly follower growth rate at 13.86%, showing it’s a great place to grow your network in retail.
Here is how other retail profiles are doing in Q4 2024:
- Instagram: 0.32%
- Facebook: 13.86%
 How often should you post on social media in the retail industry?
Our research found that the retail industry posts on Instagram more often than on other social platforms — an average of 8.2 times a week.
 Weekly frequency and engagement rates in retail on Facebook
In the retail industry on Facebook, the highest engagement rate of 1.27% is achieved with a weekly posting frequency of 3 posts.
 Weekly frequency and engagement rates in retail on Instagram
In the retail industry on Instagram, the highest engagement rate of 2.12% is achieved with a weekly posting frequency of 17 posts.
 Weekly frequency and engagement rates in retail on LinkedIn
In the retail industry on LinkedIn, the highest engagement rate of 3.6% is achieved with a weekly posting frequency of 6 posts.
 Weekly frequency and engagement rates in retail on X (Twitter)
In the retail industry on X (Twitter), the highest engagement rate of 4.6% is achieved with a weekly posting frequency of 5 posts.
 Social media benchmarks in construction, mining, and manufacturing
Best content type to post on Facebook
Social media benchmarks in construction, mining, and manufacturing
Best content type to post on Facebook
In the construction, mining, and manufacturing industry, albums perform best on Facebook at 4.1%
 Best content type to post on Instagram
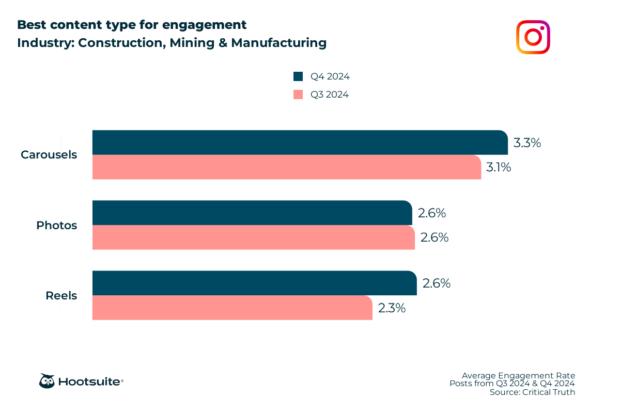
In the construction, mining, and manufacturing industry, carousels perform best on Instagram at 3.3%.
 Best content type to post on LinkedIn
In the construction, mining, and manufacturing industry, photos perform best on LinkedIn at 3.4%.
 Follower growth rate in construction, mining, and manufacturing
LinkedIn has the highest weekly follower growth rate at 21.20%, showing it’s a great place to grow your network in construction, mining, and manufacturing.
Here is how other construction, mining, and manufacturing profiles are doing in Q4 2024:
- LinkedIn: 21.20%
- Instagram: 12.55%
- Facebook: 0.08%
 How often should you post on social media in the construction, mining, and manufacturing industry?
Our research found that the construction, mining, and manufacturing industry posts on LinkedIn more often than on other social platforms — an average of 3.7 times a week.
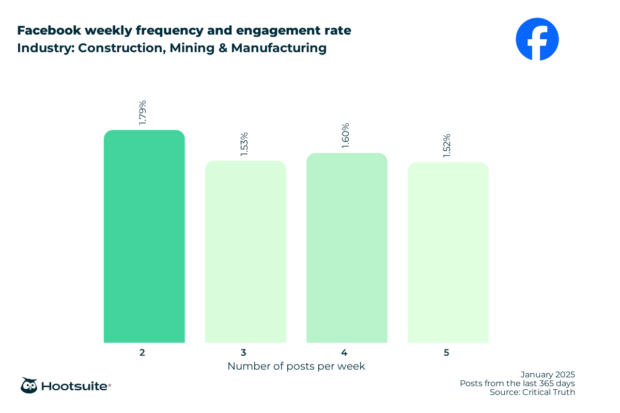
 Weekly frequency and engagement rates in construction, mining, and manufacturing on Facebook
In the construction, mining, and manufacturing industries on Facebook, the highest engagement rate of 1.79% is achieved with a weekly posting frequency of 2 posts.
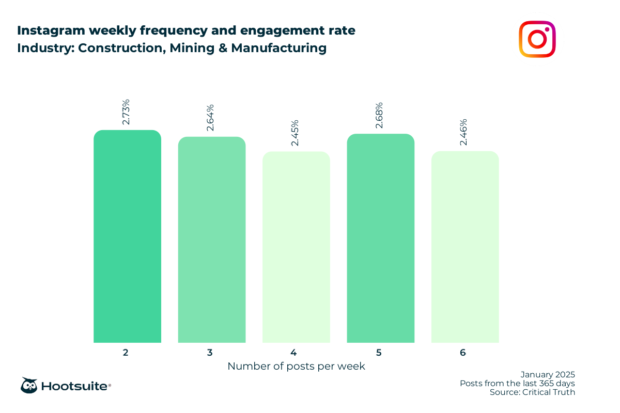
 Weekly frequency and engagement rates in construction, mining, and manufacturing on Instagram
In the construction, mining, and manufacturing industries on Instagram, the highest engagement rate of 2.73% is achieved with a weekly posting frequency of 2 posts.
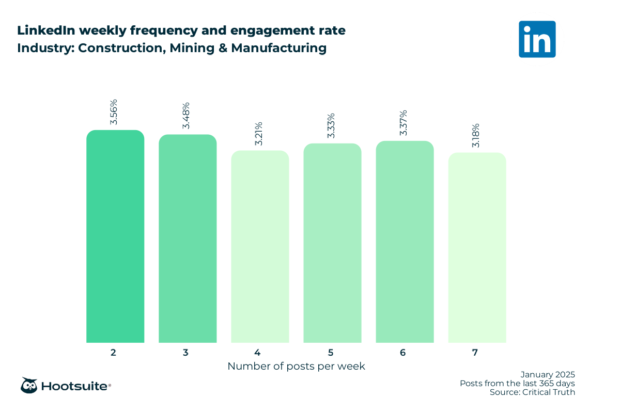
 Weekly frequency and engagement rates in construction, mining, and manufacturing on LinkedIn
In the construction, mining, and manufacturing industries on LinkedIn, the highest engagement rate of 3.56% is achieved with a weekly posting frequency of 2 posts.
 Weekly frequency and engagement rates in construction, mining, and manufacturing on X (Twitter)
In the construction, mining, and manufacturing industries on X (Twitter), the highest engagement rate of 5.5% is achieved with a weekly posting frequency of 2 posts.
 Social media benchmarks in marketing agencies
Best content type to post on Facebook
Social media benchmarks in marketing agencies
Best content type to post on Facebook
In the marketing agencies industry, albums perform best on Facebook at 4.6%
 Best content type to post on Instagram
In the marketing agencies industry, carousels perform best on Instagram at 6.8%.
 Best content type to post on LinkedIn
In the marketing agencies industry, photos perform best on LinkedIn at 3.6%.
 Best content type to post on X (Twitter)
In the marketing agencies industry, quotes perform best on LinkedIn at 6.7%.
 How often should you post on social media in the marketing agencies industry?
Our research found that the marketing agencies post on X (Twitter) and Facebook more often than on other social platforms — an average of 13.6 and 4.8 times a week.
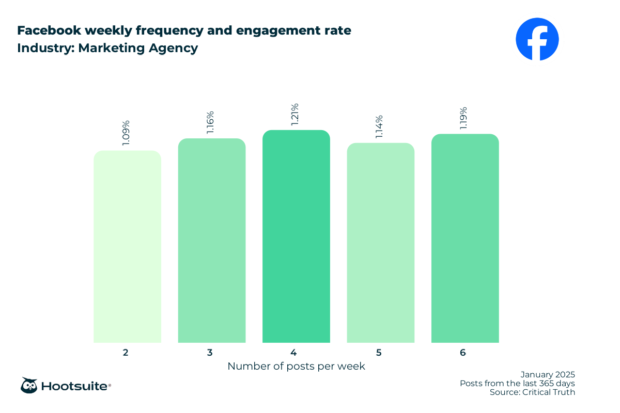
 Weekly frequency and engagement rates in marketing agencies on Facebook
In the marketing agencies industry on Facebook, the highest engagement rate of 1.21% is achieved with a weekly posting frequency of 4 posts.
 Weekly frequency and engagement rates in marketing agencies on Instagram
In the marketing agencies industry on Instagram, the highest engagement rate of 8.5% is achieved with a weekly posting frequency of 13 posts.
 Weekly frequency and engagement rates in marketing agencies on LinkedIn
In the marketing agencies industry on LinkedIn, the highest engagement rate of 4.6% is achieved with a weekly posting frequency of 14-16 posts.
 Weekly frequency and engagement rates in marketing agencies on X (Twitter)
In the marketing agencies industry on X (Twitter), the highest engagement rate of 7.1% is achieved with a weekly posting frequency of 2 posts.
 Social media benchmarks in nonprofits
Best content type to post on Facebook
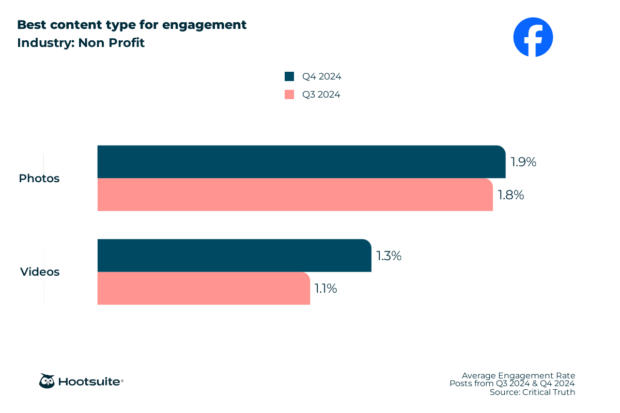
Social media benchmarks in nonprofits
Best content type to post on Facebook
In the nonprofit industry, photos perform best on Facebook at 1.9%
 Best content type to post on Instagram
In the nonprofit industry, carousels perform best on Instagram at 6.5%.
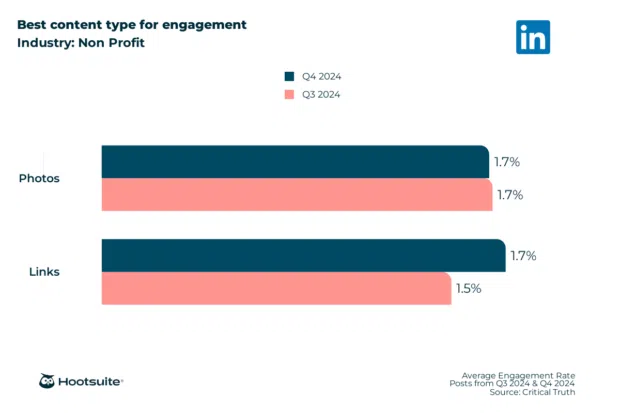
 Best content type to post on LinkedIn
In the nonprofit industry, photos perform best on LinkedIn at 1.7%.
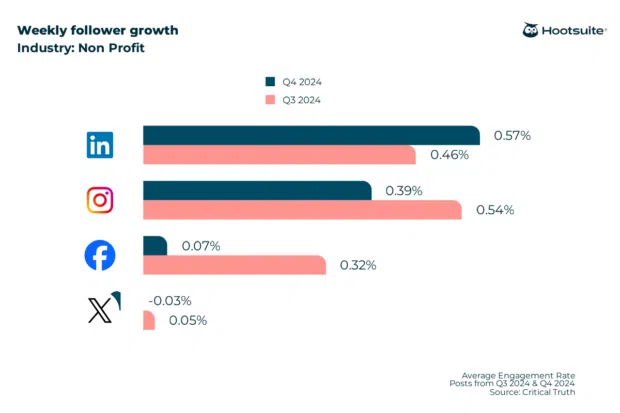
 Follower growth rate in nonprofit
LinkedIn has the highest weekly follower growth rate at 0.57%, showing it’s a great place to grow your network in nonprofit.
Here is how other nonprofit profiles are doing in Q4 2024:
- LinkedIn: 0.57%
- Instagram: 0.39%
- X (Twitter): -0.03%
- Facebook: 0.07%
 How often should you post on social media in the nonprofit industry?
Our research found that the nonprofit industry posts on LinkedIn more often than on other social platforms — an average of 8.8 times a week.
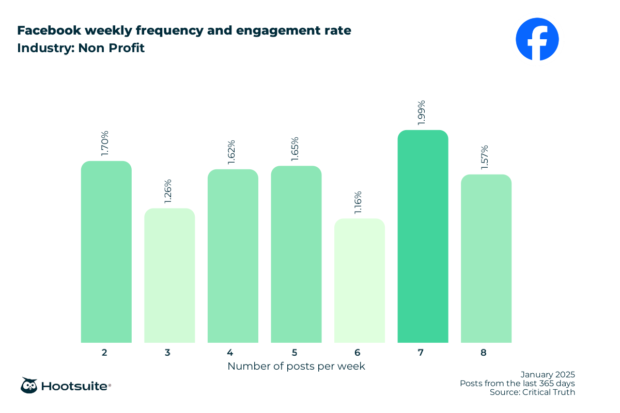
 Weekly frequency and engagement rates in nonprofits on Facebook
In the nonprofit industry on Facebook, the highest engagement rate of 1.99% is achieved with a weekly posting frequency of 7 posts.
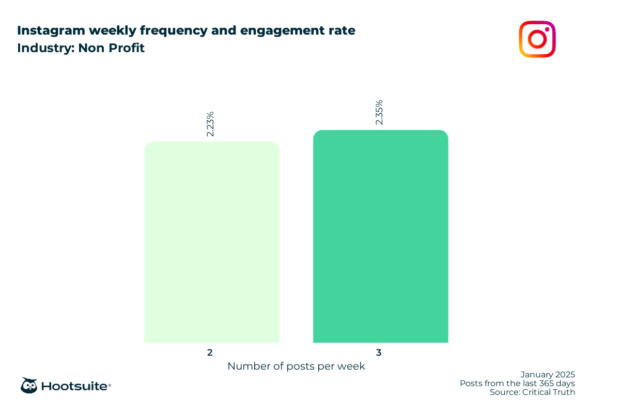
 Weekly frequency and engagement rates in nonprofits on Instagram
In the nonprofit industry on Instagram, the highest engagement rate of 2.35% is achieved with a weekly posting frequency of 3 posts.
 Weekly frequency and engagement rates in nonprofits on LinkedIn
In the nonprofit industry on LinkedIn, the highest engagement rate of 3.0% is achieved with a weekly posting frequency of 9 posts.
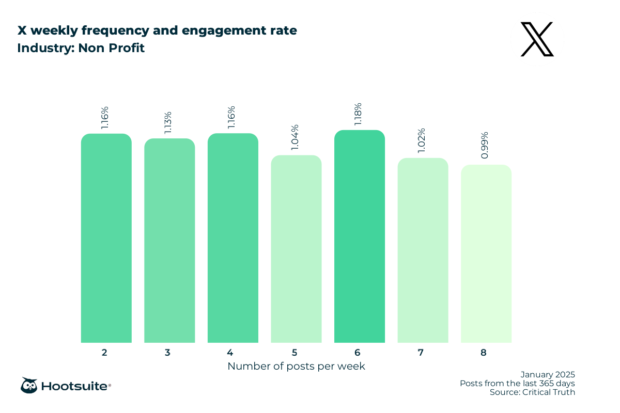
 Weekly frequency and engagement rates in nonprofits on X (Twitter)
In the nonprofit industry on X (Twitter), the highest engagement rate of 1.18% is achieved with a weekly posting frequency of 6 posts.
 Social media benchmarks in technology
Best content type to post on Facebook
Social media benchmarks in technology
Best content type to post on Facebook
In the technology industry, status updates perform best on Facebook at 10.0%
 Best content type to post on Instagram
In the technology industry, carousels perform best on Instagram at 7.4%.
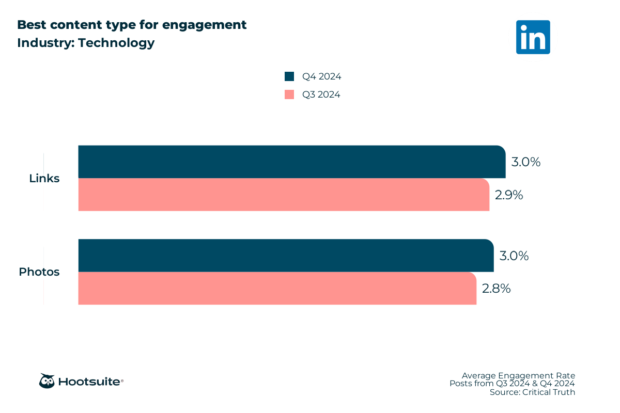
 Best content type to post on LinkedIn
In the technology industry, links and photos perform equally well on LinkedIn at 3.0%.
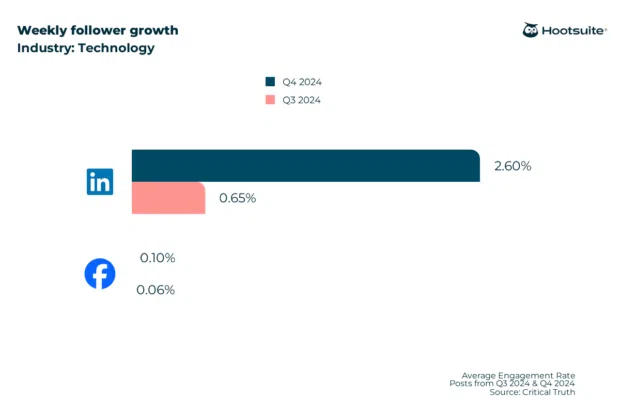
 Follower growth rate in technology
LinkedIn has the highest weekly follower growth rate at 2.60%, showing it’s a great place to grow your network in technology.
Here is how other technology profiles are doing in Q4 2024:
- LinkedIn: 2.60%
- Facebook: 0.10%
 How often should you post on social media in the technology industry?
Our research found that the technology industry posts on LinkedIn more often than on other social platforms — an average of 2.6 times a week.
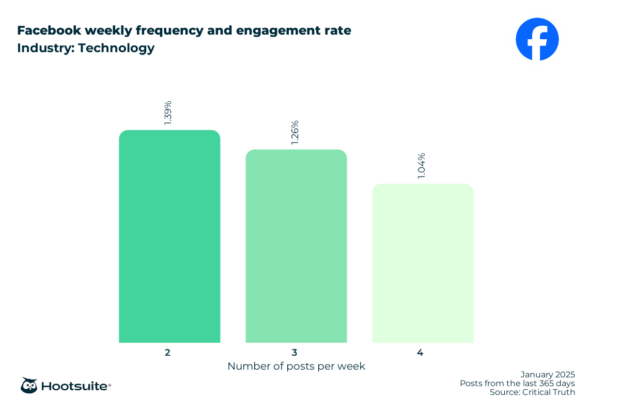
 Weekly frequency and engagement rates in technology on Facebook
In the technology industry on Facebook, the highest engagement rate of 1.39% is achieved with a weekly posting frequency of 2 posts.
 Weekly frequency and engagement rates in technology on Instagram
In the technology industry on Instagram, the highest engagement rate of 8.5% is achieved with a weekly posting frequency of 8 posts.
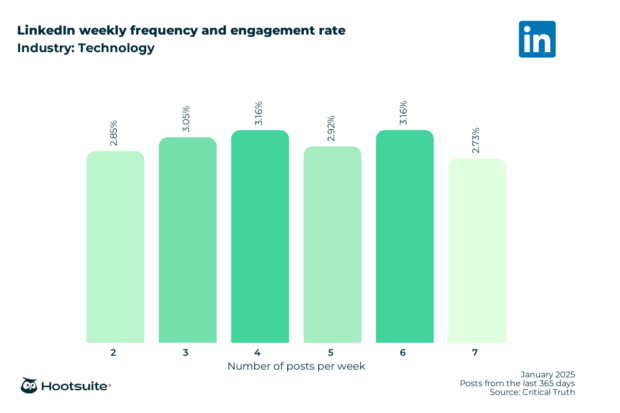
 Weekly frequency and engagement rates in technology on LinkedIn
In the technology industry on LinkedIn, the highest engagement rate of 3.16% is achieved with a weekly posting frequency of 4 or 6 posts.
 Weekly frequency and engagement rates in technology on X (Twitter)
In the technology industry on X (Twitter), the highest engagement rate of 4.4% is achieved with a weekly posting frequency of 1 post.
 Social media benchmarks in utilities and energy
Best content type to post on Facebook
Social media benchmarks in utilities and energy
Best content type to post on Facebook
In the utilities and energy industry, albums perform best on Facebook at 6.5%
 Best content type to post on Instagram
In the utilities and energy industry, carousels perform best on Instagram at 8.6%.
 Best content type to post on LinkedIn
In the utilities and energy industry, videos and photos perform equally well on LinkedIn at 2.4%.
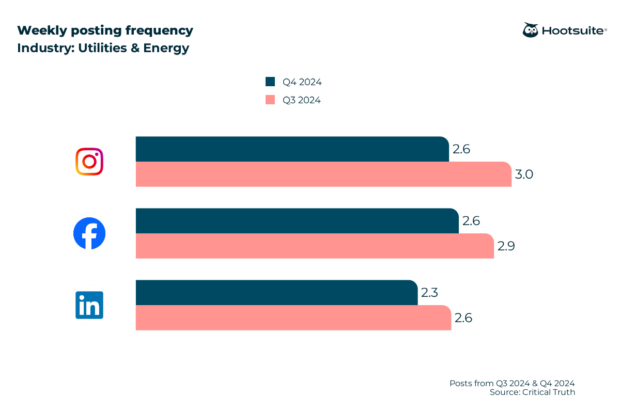
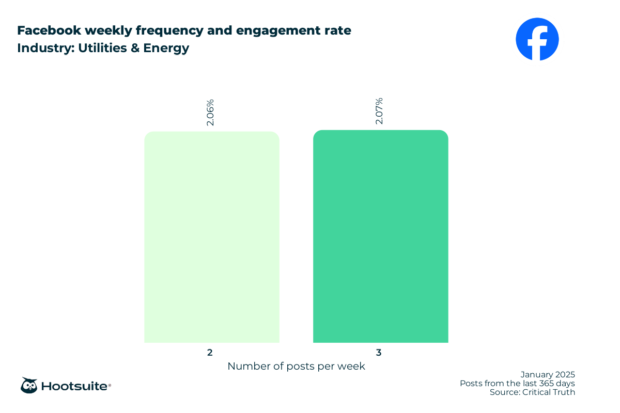
 How often should you post on social media in the utilities and energy industry?
Our research found that the utilities and energy industry posts on Instagram and Facebook an average of 2.6 times a week.
 Weekly frequency and engagement rates in utilities and energy on Facebook
In the utilities and energy industry on Facebook, the highest engagement rate of 2.07% is achieved with a weekly posting frequency of 3 posts.
 Weekly frequency and engagement rates in utilities and energy on LinkedIn
In the utilities and energy industry on LinkedIn, the highest engagement rate of 2.7% is achieved with a weekly posting frequency of 1 post.
 Social media benchmarks overall
Best content type to post on Facebook
Social media benchmarks overall
Best content type to post on Facebook
Overall, albums perform best on Facebook at 1.6%
 Best content type to post on Instagram
Overall, carousels perform best on Instagram at 2.4%.
 Best content type to post on LinkedIn
Overall, videos perform best on LinkedIn at 3.8%.
 Best content type to post on X (Twitter)
Overall, photos perform best on X (Twitter) at 3.7%.
 Follower growth rate overall
TikTok has the highest weekly follower growth rate at 29.99%, showing it’s a great place to grow your network overall.
Here is how other profiles are doing in Q4 2024:
- TikTok: 29.99%
- Instagram: 14.70%
- LinkedIn: 5.28%
- Facebook: 2.16%
- X (Twitter): 0.11%
 How often should you post on social media overall?
Our research found that overall, industries post on X (Twitter) more often than on other social platforms — an average of 61 times a week.
 Weekly frequency and engagement rates overall on Facebook
Overall on Facebook, the highest engagement rate of 1.61% is achieved with a weekly posting frequency of 10 posts.
 Weekly frequency and engagement rates overall on Instagram
Overall on Instagram, the highest engagement rate of 2.33% is achieved with a weekly posting frequency of 2 posts.
 Weekly frequency and engagement rates overall on LinkedIn
Overall on LinkedIn, the highest engagement rate of 3.15% is achieved with a weekly posting frequency of 6 posts.
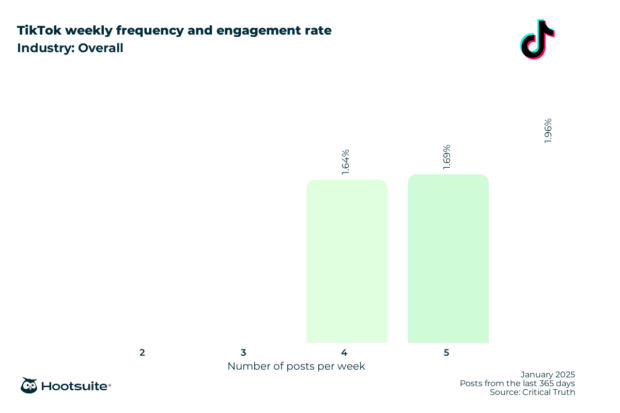
 Weekly frequency and engagement rates overall on TikTok
Overall on TikTok, the highest engagement rate of 1.69% is achieved with a weekly posting frequency of 5 posts.
 Weekly frequency and engagement rates overall on X (Twitter)
Overall on X (Twitter), the highest engagement rate of 1.53% is achieved with a weekly posting frequency of 6 posts.
 4 ways to use social media benchmarks to grow your social presence
1. Understand how you’re doing
4 ways to use social media benchmarks to grow your social presence
1. Understand how you’re doing
Tracking your metrics in isolation is only useful to a certain point. You can see how your social presence is growing and identify peaks and valleys in your own performance.
But without the bigger picture of your industry, it’s hard to know what any of that really means. Maybe your growth feels slow but it’s exceeding the pace of your competitors. Or maybe your engagement rate feels good enough, but a competitive analysis would show you could be aiming much higher.
This context is particularly important when sharing results beyond your immediate team. Meeting or exceeding industry benchmarks shows real value in the work you and your team do. If you’re struggling to meet benchmarks and can identify why, you can use this information to underpin a request for additional resources.
Benchmarks are also a helpful resource to have in your back pocket when you get the inevitable request from a client or other stakeholder to just “make a viral video.”
2. Set realistic goalsWe talk a lot on this blog about the importance of SMART goals. Benchmarking is a requirement for understanding the A and R parts of SMART: attainability and relevance.
Knowing what others in your industry are currently achieving makes it much easier to set business goals that make you stretch just far enough to achieve great things.
3. Replicate winning strategies from leaders in your industryAs we’ve just said, you can gain a lot of insight by comparing your own results to industry benchmarks. But you can take those insights even further by identifying leaders in your industry that are achieving results that outpace the benchmarks.
One way to spot these industry leaders is to set up social listening streams using industry keywords. As you start to recognize important voices in your niche, take a look at their accounts to get a sense of their social media strategy.
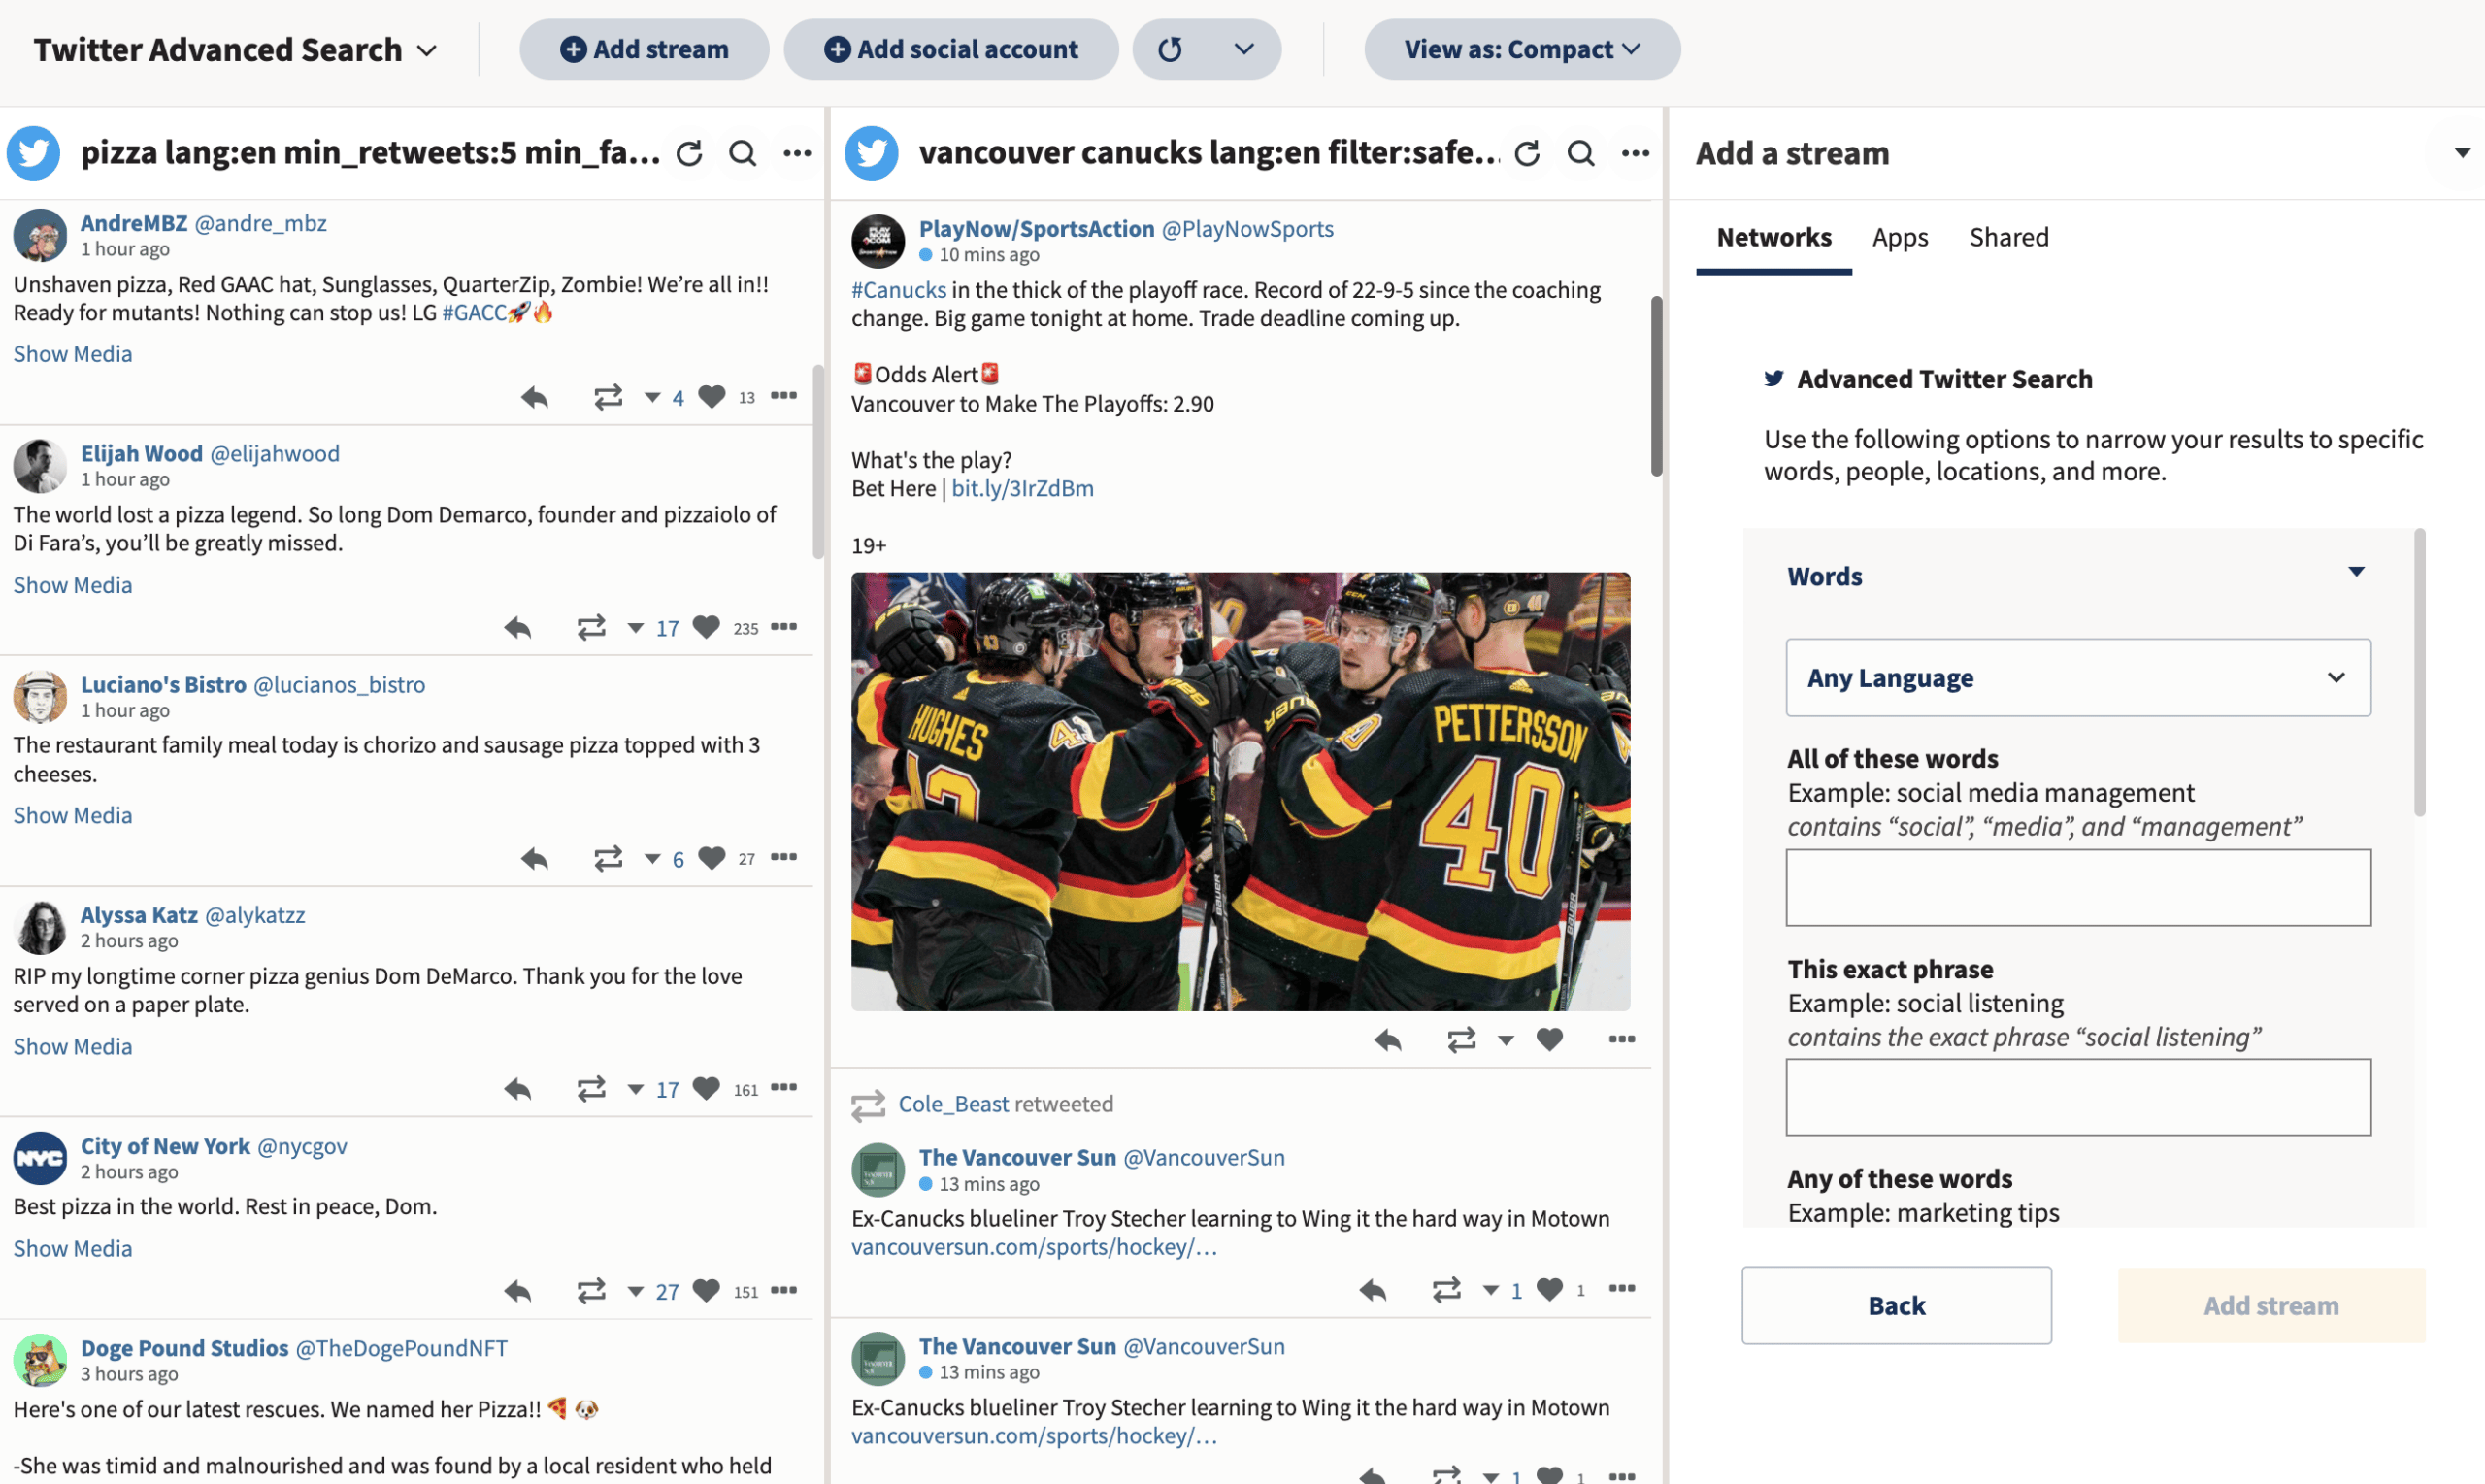
Their posting frequency is easy to identify through a simple tally. You can also get a sense of their engagement rate by comparing the likes (if visible) and comments with their total number of followers.
When you spot an account with particularly high engagement rates, try to do some reverse engineering to understand what might be working for them, and think about ways you can incorporate those lessons into your own strategy.
4. Spot opportunities earlyYou might have noticed that the benchmark audience growth rate was slightly negative for several of the industries above, particularly for Instagram. If you’re specifically focused on growing an audience quickly and you’re in one of these industries, this may be a sign you should focus your efforts on other platforms.
As always, this is just a jumping-off point for your own testing. You might find, for example, that those people who have unfollowed the Instagram accounts of retail industry leaders are looking for new small businesses to follow. Incorporate benchmarks into your brainstorming, but don’t let them become your only source of strategic inspiration.
Use Hootsuite to get industry benchmarks, schedule posts, track results, and do all your social media reporting from a single dashboard. Try it free today.
The post Social media benchmarks: Q1 2025 data + tips appeared first on Social Media Marketing & Management Dashboard.