and the distribution of digital products.
Polkadot Offering 30% Upside: Buy Now?
Polkadot’s ability to enable interoperability and scalability through its relay chain and parachains makes it a cornerstone in blockchain technology
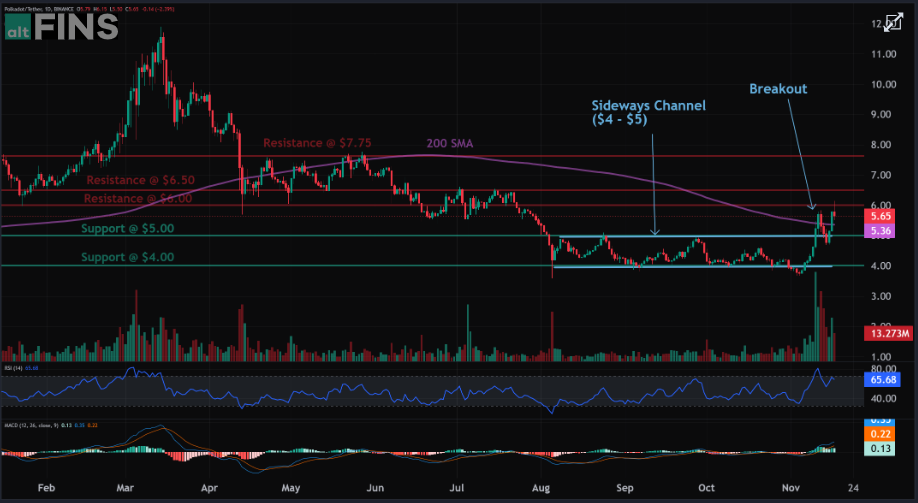
Price is Approaching Resistance, which is a level where it could pause or reverse its recent advance, at least temporarily. Resistance is often a level where price got rejected in the past, or potentially prior Support level that was broken. Once price breaks above resistance, it can advance higher to the next resistance level.
For on-demand analysis of any cryptocurrency, join our Telegram channel.
Polkadot Crypto Price OverviewAPolkadot (DOT) is trading at $5.57. Here are the key market metrics:
- Market Cap: $8.46 billion
- 24h Trading Volume: $907.35 million
- Circulating Supply: 1.52 billion DOT
- Total Supply: 1.3 billion DOT
- All-Time High (ATH): $54.28
- Year-to-Date Change: -34.07%.
 Img src- Altfins
Price broke out of the Sideways Channel ($4.00 – $5.00), which signaled bullish trend reversal, and reached $6.00 for +20% gain.
Now we look for the right entry opportunity in Uptrend. We wait for price to either
1) break above $6.00 to signal continuation of uptrend, with +30% upside potential to $7.75 next, or
2) pull back near $5.00 support for another swing trade entry in Uptrend with +20% upside potential back to $6.00. Stop Loss at $4.46.
Buy Now Weekly Price Analysis- Weekly Low: $4.62
- Weekly High: $6.04
- Volatility: Medium, influenced by broader market trends.
- Trend: Short-term trend is Strong Up, Medium-term trend is Up, Long-term trend is Down.
- Momentum is Bullish ( MACD Line crossed above MACD Signal Line) ABOVE days ago. Price is neither overbought nor oversold currently.
- Support and Resistance: Nearest Support Zone is $5.00, then $4.00. Nearest Resistance Zone is $6.00, then $6.50.
- RSI (Relative Strength Index): Neutral at 48.
- MACD (Moving Average Convergence Divergence): Slightly bullish crossover observed.
- 200-Day Moving Average: DOT remains below this level.
- Parachain Expansion: Polkadot continues to innovate with its interoperable blockchain technology.
- Development Updates: New governance models and upgrades to the Substrate framework aim to improve efficiency and scalability.
- Community Engagement: Increased staking participation, with DOT holders showing strong interest in on-chain governance initiatives.
For on-demand analysis of any cryptocurrency, join our Telegram channel.
- Home
- About Us
- Write For Us / Submit Content
- Advertising And Affiliates
- Feeds And Syndication
- Contact Us
- Login
- Privacy
All Rights Reserved. Copyright , Central Coast Communications, Inc.