and the distribution of digital products.
Optimizing Failure Rates in Trustee-Based Recovery Systems
Related Work
The Proposed Secret Backup Approaches
Security and Reliability Analysis
\
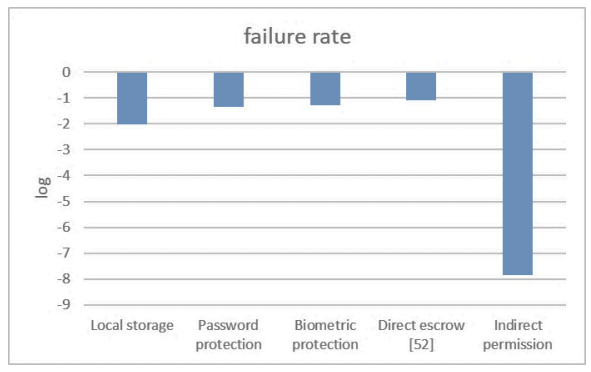
4.4 Real World ParametersWe adopt appropriate parameters to estimate the failure rate F by referring to available statistical or published research data. We assume a reasonable range of values for analysis for those with no referenced data. The real-world data references are more realistic, although sometimes they differ from theoretical numbers. For example, a long enough password is theoretically hard to guess, but in reality, people tend to use some common words for convenience. Therefore, a test on real-world password sets is closer to the realistic security level of the password approach [42].
\
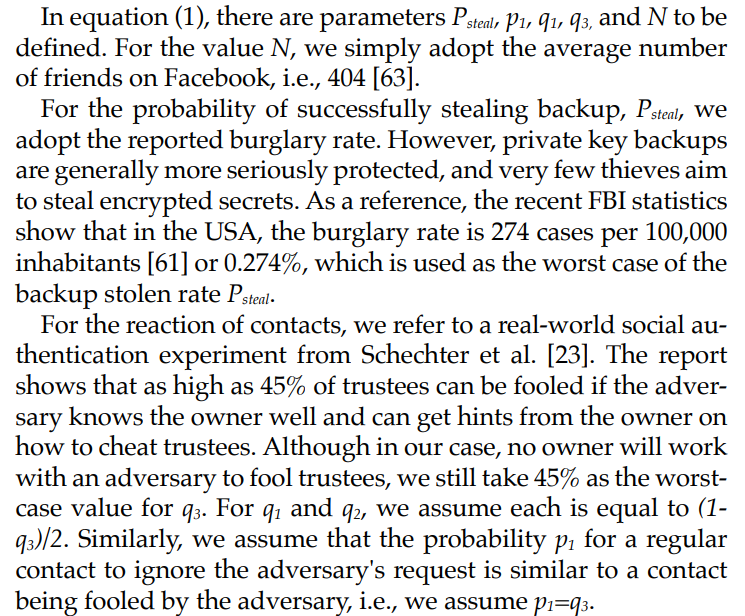
\ Then in equation 2, only the trustee unavailable rate U is to be identified. Although the actual U value is known only until our method's real deployment, we assume 0.1% failed trustees for later calculations.
\
\
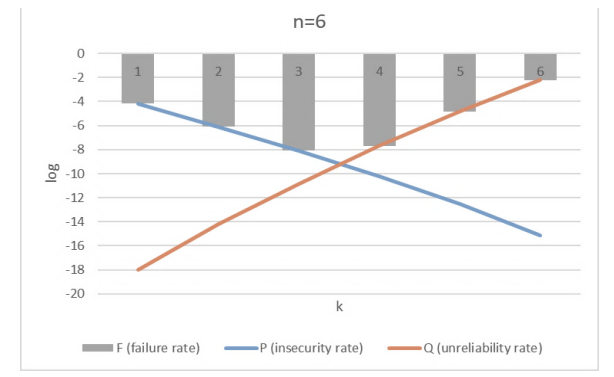
4.5 Failure Rate Optimization of (k,n)We then compute the probabilities P (insecurity rate), Q (unreliability rate), and F (failure rate) using the values quoted in the previous subsection. For example, we show in Fig. 3 the failure rates of different recovery thresholds k's for the choice of 6 trustees.
\
\
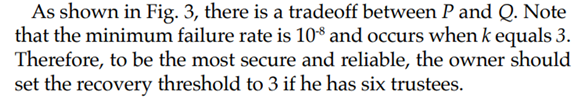
\ \ Therefore, for each choice of n, one may calculate the optimum k. Hence, we show in Fig. 4 the minimum failure rate and the corresponding k value for each option of the number of trustees n. Practically, one may determine the target allowable failure rate and use this table to choose the optimal parameters of (k, n).
\
\
\
\
\
\
:::info Authors:
(1) Wei-Hsin Chang, Deepmentor Inc. ([email protected]);
(2) Ren-Song Tsay, Computer Science Department, National TsingHua University, Hsinchu, Taiwan ([email protected]).
:::
:::info This paper is available on arxiv under CC BY 4.0 DEED license.
:::
\