and the distribution of digital products.
New Research Cuts AI Training Time Without Sacrificing Accuracy
:::info Authors:
(1) Anonymous authors Paper under double-blind review Jarrod Haas, SARlab, Department of Engineering Science Simon Fraser University; Digitalist Group Canada and [email protected];
(2) William Yolland, MetaOptima and [email protected];
(3) Bernhard Rabus, SARlab, Department of Engineering Science, Simon Fraser University and bernhardt[email protected].
:::
\
- Abstract and 1 Introduction
- 2 Background
- 2.1 Problem Definition
- 2.2 Related Work
- 2.3 Deep Deterministic Uncertainty
- 2.4 L2 Normalization of Feature Space and Neural Collapse
- 3 Methodology
- 3.1 Models and Loss Functions
- 3.2 Measuring Neural Collapse
- 4 Experiments
- 4.1 Faster and More Robust OoD Results
- 4.2 Linking Neural Collapse with OoD Detection
- 5 Conclusion and Future Work, and References
- A Appendix
- A.1 Training Details
- A.2 Effect of L2 Normalization on Softmax Scores for OoD Detection
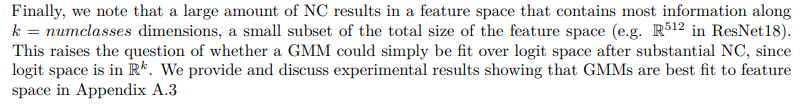
- A.3 Fitting GMMs on Logit Space
- A.4 Overtraining with L2 Normalization
- A.5 Neural Collapse Measurements for NC Loss Intervention
- A.6 Additional Figures
Our results in Table 1 demonstrate that L2 normalization over feature space produces results that are competitive with or exceed those obtained using the DDU benchmark, and are obtained in less training time for ResNet18 and ResNet50 models. For ResNet18, our mean Area Under the Receiver-Operator Curve (AUROC) scores exceed those of the baseline in only 60 epochs (17% of DDU baseline training time), with only a .008 reduction in classification accuracy. For ResNet50, we achieve higher mean accuracy than the the baseline in only 100 epochs (29% of DDU baseline training time), while mean AUROC is lower by only 1 point.
\
\ Most notably, the lower bounds of OoD detection performance are significantly improved on both models (Table 1). For Resnet18, we improve the AUROC baseline by .047, and on ResNet50 we improve by .024. These effects are even more pronounced when compared with the same number of training epochs in the absence of L2 normalization. Note that while AUROC and classification scores might improve with more training, our scope here is to emphasize that a substantial reduction in compute time is possible with this technique. We achieve substantially better worst case OoD performance with only a fraction of the training time stated in the DDU benchmark. Notably, the variability of AUROC performance across models trained from different initializations is also heavily decreased with L2.
\ An ablation study shows that mean accuracy, minimum accuracy, and AUROC are all improved across each of the pairwise L2/no-L2 comparisons (Table 2). Furthermore, the worst performing models (min and mean AUROC) using L2 normalization still exceed the best performing models trained without L2 normalization across the same metrics
\ We also assess how standard softmax scores perform when used as OoD decision scores. These results are detailed in Table 4 in Appendix A.2. Softmax scores perform worse in all cases, with the exception of the ResNet50, No L2 350 epoch model.
\
Our intuition that L2 normalization over feature space would induce NC faster is empirically proven throughout our experiments. All aspects of NC are induced more rapidly, with nearly all measures showing greater NC in 60 epochs than the equivalent model counterparts trained for 350 epochs without L2 normalization (Table 3). We also note that in models without L2 normalization, NC is generally an order of magnitude less after 60 epochs than those with L2 normalization (Table 3).
\
\
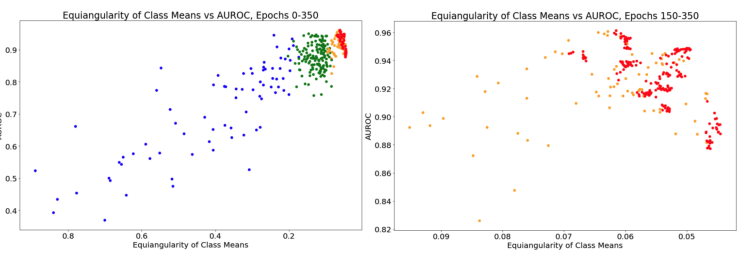
\ Figure 3 shows the effect of training non-L2 normalized ResNet18s for 350 epochs on NC and AUROC scores. As expected, NC is strongly correlated with OoD performance. We also note evidence that too much NC can slightly reduce performance from peak (Figure 3, Right).
\ 4.2.1 Neural Collapse Training Intervention
\ To further investigate the connection between NC and OoD performance, we use 15 random seeds of ResNet18 models trained for 350 epochs with no L2 normalization. We observe during training that after 50 epochs, accuracy and AUROC scores both approach noisy plateaus. We use this observation to create two groups, a control and an intervention. All models within these groups are initialized using the 50th epoch of their respective seed. Both groups then begin training at an order of magnitude lower loss to encourage convergence, and both groups step down the loss after 10 epochs to control for the possible effect of learning rate. The control group models continue training using the standard cross entropy loss. The intervention group is trained using the differentiable NC metrics listed in Equation 3.
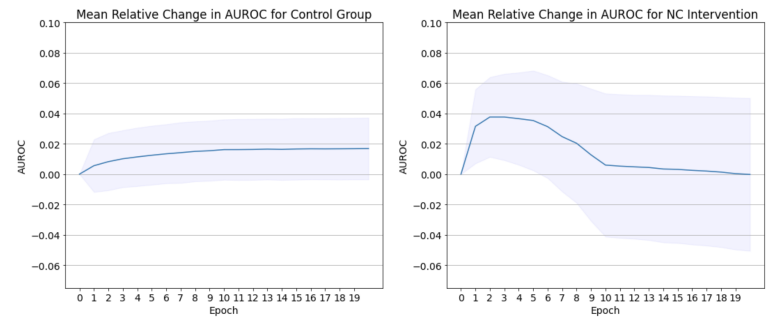
\ As shown in Figure 7 (Appendix A.5), models in the intervention group have substantially greater amounts of NC, as expected. CE loss and classification accuracy remain relatively stable in the intervention models, owing to the fact that CE is excluded from the loss function. The intervention group is thus disentangled from confounding influence from the learning rate or the CE objective. However, in Figure 4, we see that AUROC is substantially different between the intervention and control groups.
\ Models perform better under NC and these improved scores arrive with less training: after only 2 epochs. Intervention models improve AUROC an average of 0.038 points from intervention onset, 4.75x the average improvement of .008 from control models during this time. Even if allowed to train for the full 20 epochs, control models improve to a maximum average of .017.
\
\
\ 4.2.2 Investigating Collapse
\ Figure 4 shows that too much training directly with NC loss hinders performance. This aligns with our intuition that too much NC can adversely effect the bi-Lipschitz constraint: extracted OoD features are not sufficiently differentiated from ID features and get collapsed into class clusters.
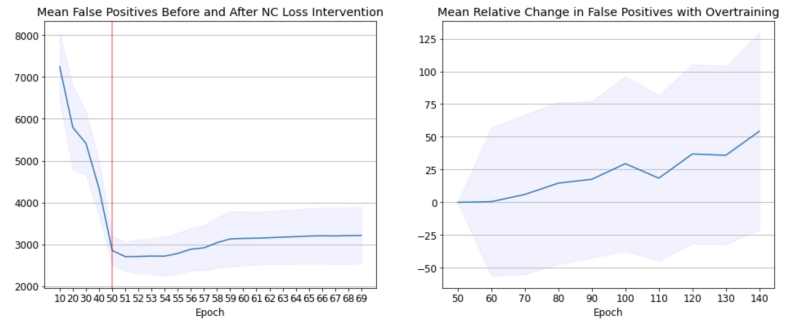
\ To examine this, we measure the false positive detection rate before and during the NC intervention (Figure 5). As there are ten thousand ID test images with CIFAR10, false positives are defined as OoD images that have confidence scores in the top ten thousand of all scores. As expected, the false positive rate drops steadily up to and shortly beyond intervention onset, but then begins to increase again. Since we know that variability is collapsing (Figure 7) as the false positive rate increases, we know that OoD images are getting higher scores due to their collapse into class means along with ID images.
\ To see if a similar effect occurs under NC from CE loss, we over-train our L2 normalized ResNet18 model from 60 epochs through to 150 epochs. Figure 5 shows that the false positive rate remains stable for approximately 10 epochs before increasing nearly monotonically for the remainder of training. However, in this case the effect is an order of magnitude smaller than when we use NC loss. Instead of an extra 500 (on average) false positives within 20 epochs, the L2 case only increases by an average of 54 false positives after an extra 90 epochs of training. When over-training our no L2 baseline from 350 to 500 epochs, false positives increase by a maximum average of 20.
\ Using L2 normalization on feature space is quite stable, and peak or near-peak results can be obtained without much fine-tuning of training length. However, we do note that there is a trade off between classification accuracy and OoD detection performance. When substantially overtraining to 350 epochs with L2 normalization, accuracy scores improve slightly over the no L2 cases, but OoD performance takes a significant penalty (see Table 6, Appendix A.4). We thus note that our method is best used with short training schedules. Highest accuracy on validation can still be used to guide training, but shouldn’t be used to determine optimal OoD performance.
\ Over-training directly with NC loss can have a large detrimental effect, despite it resulting in similar NC measurements to the counterpart CE loss cases. It is not optimal to simply induce NC on a pre-converged model via NC loss, although doing so can significantly boost AUROC scores. This suggests that CE loss, as well it’s potential interactions with spectral norm and leaky ReLUs plays an important role in conditioning feature space with an optimal bi-Lipschitz constraint. The benefit of this, however, is that our method is stable with respect to training–there is no need to monitor NC measurements in order to arrive at or near the peak of OoD performance or reap the benefits of much improved worst-cast performance.
\ Finally, we observe that while NC is directly correlated with improved OoD performance as explained above, per model amounts of NC are not directly correlated with peak AUROC. In other words, although optimal OoD detection happens within a similar range of NC measurements, specific amounts of NC cannot be used to precisely predict peak AUROC scores for a given model. Again, this harmonizes with our intuition that NC is only one of several factors acting to condition feature space for OoD detection. These factors are all susceptible to the variability of training dynamics, as well as situational dependencies such as architectures and datasets.
\
:::info This paper is available on arxiv under CC BY-NC-ND 4.0 DEED license.
:::
\