and the distribution of digital products.
DM Television
Java Backend Observability with OpenTelemetry Traces and Minimal Code
Hello everyone! I'm Dmitriy Apanasevich, Java Developer at MY.GAMES, working on the game Rush Royale, and I'd like to share our experience integrating the OpenTelemetry framework into our Java backend. There’s quite a bit to cover here: We’ll cover necessary code changes required to implement it, as well as the new components we needed to install and configure – and, of course, we’ll share some of our results.
Our goal: achieving system observabilityLet’s give some more context to our case. As developers, we want to create software that’s easy to monitor, evaluate, and understand (and this is precisely the purpose of implementing OpenTelemetry — to maximize system observability).
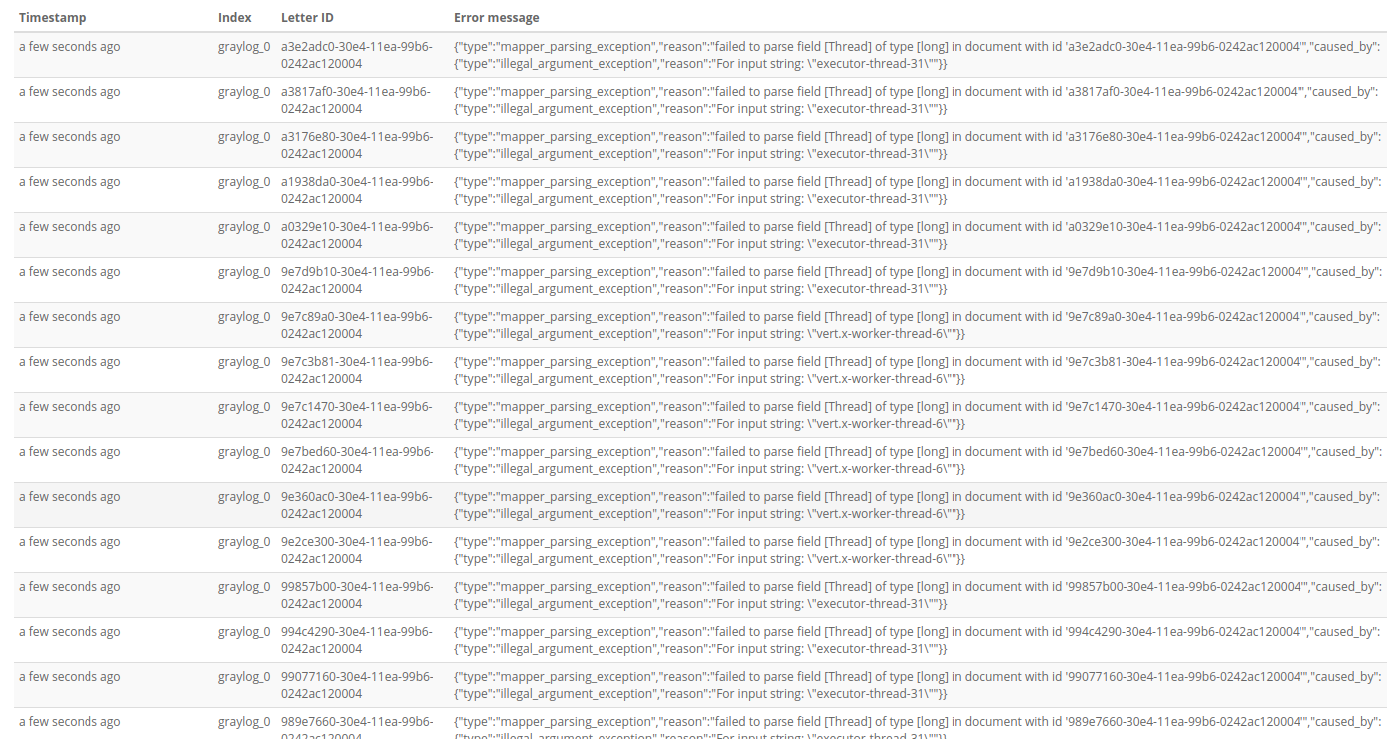
\ Traditional methods for gathering insights into application performance often involve manually logging events, metrics, and errors:
\
\ Of course, there are many frameworks that allow us to work with logs, and I’m sure that everyone reading this article has a configured system for collecting, storing and analyzing logs.
\ Logging was also fully configured for us, so we did not use the capabilities provided by OpenTelemetry for working with logs.
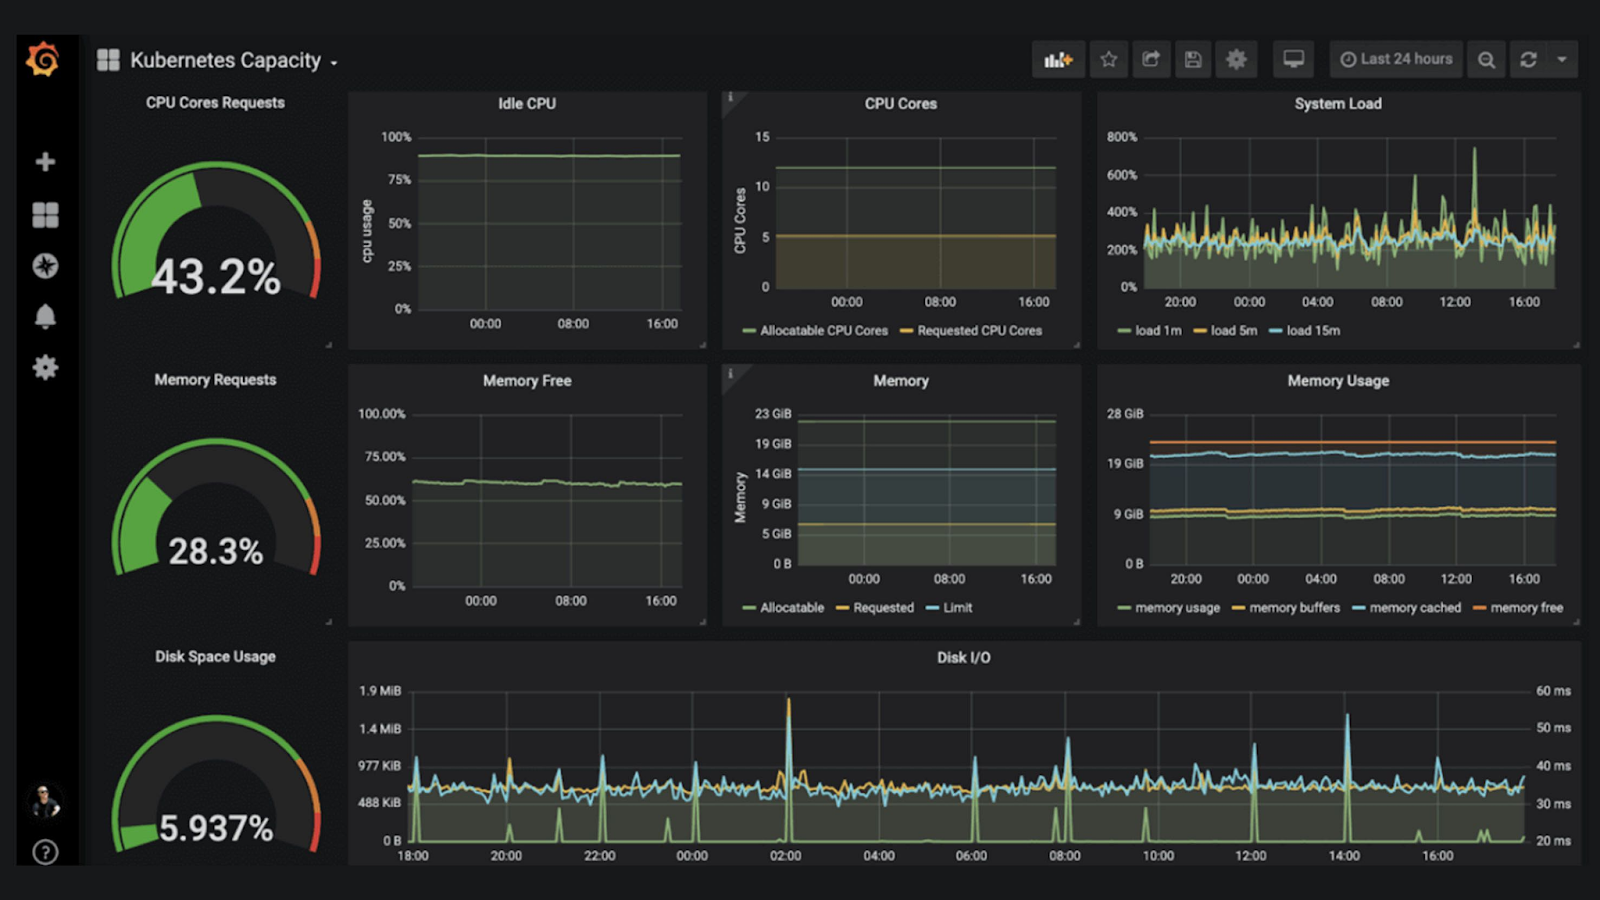
\ Another common way to monitor the system is by leveraging metrics:
\
We also had a fully configured system for collecting and visualizing metrics, so here too we ignored the capabilities of OpenTelemetry in terms of working with metrics.
\ But a less common tool for obtaining and analyzing this kind of system data are traces.
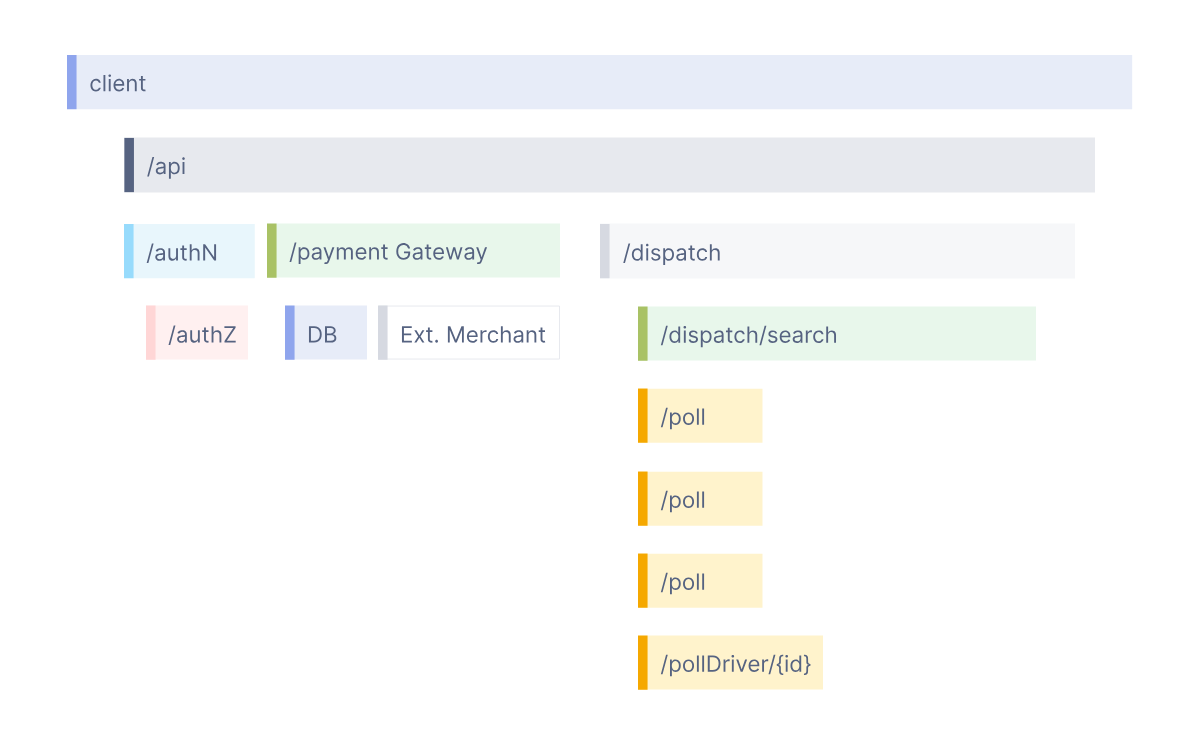
\ A trace represents the path a request takes through our system during its lifetime, and it typically begins when the system receives a request and ends with the response. Traces consist of multiple spans, each representing a specific unit of work determined by the developer or their library of choice. These spans form a hierarchical structure that helps visualize how the system processes the request.
\ For this discussion, we'll concentrate on the tracing aspect of OpenTelemetry.
Some more background on OpenTelemetryLet’s also shed some light on the OpenTelemetry project, which came about by merging the OpenTracing and OpenCensus projects.
\ OpenTelemetry now provides a comprehensive range of components based on a standard that defines a set of APIs, SDKs, and tools for various programming languages, and the project’s primary goal is to generate, collect, manage, and export data.
\ That said, OpenTelemetry does not offer a backend for data storage or visualization tools.
\ Since we were only interested in tracing, we explored the most popular open-source solutions for storing and visualizing traces:
- Jaeger
- Zipkin
- Grafana Tempo
\ Ultimately, we chose Grafana Tempo due to its impressive visualization capabilities, rapid development pace, and integration with our existing Grafana setup for metrics visualization. Having a single, unified tool was also a significant advantage.
OpenTelemetry componentsLet’s also dissect the components of OpenTelemetry a bit.
\ The specification:
API — types of data, operations, enums
SDK — specification implementation, APIs on different programming languages. A different language means a different SDK state, from alpha to stable.
Data protocol (OTLP) and semantic conventions
\
The Java API the SDK:
- Code instrumentation libraries
- Exporters — tools for exporting generated traces to the backend
- Cross Service Propagators — a tool for transferring execution context outside the process (JVM)
\ The OpenTelemetry Collector is an important component, a proxy that receives data, processes it, and passes it on – let's take a closer look.
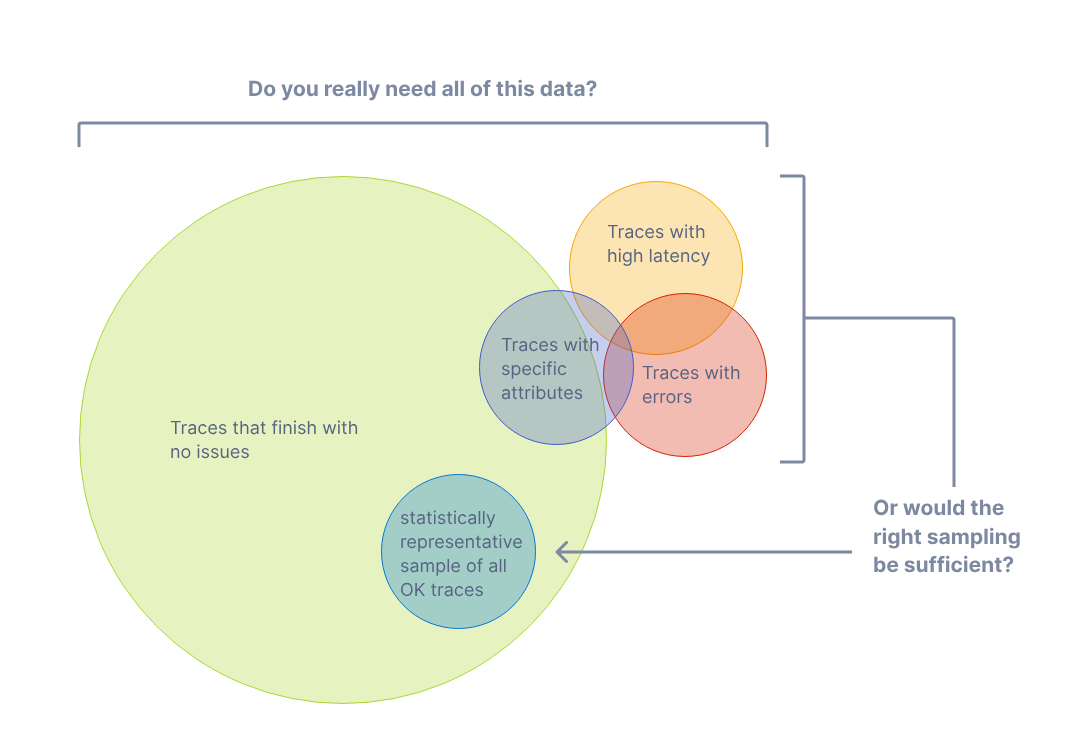
OpenTelemetry CollectorFor high-load systems handling thousands of requests per second, managing the data volume is crucial. Trace data often surpasses business data in volume, making it essential to prioritize what data to collect and store. This is where our data processing and filtering tool comes in and enables you to determine which data is worth storing. Typically, teams want to store traces that meet specific criteria, such as:
\
Traces with response times exceeding a certain threshold.
Traces that encountered errors during processing.
Traces that contain specific attributes, such as those that passed through a certain microservice or were flagged as suspicious in the code.
A random selection of regular traces that provide a statistical snapshot of the system's normal operations, helping you understand typical behavior and identify trends.
Here are the two main sampling methods used to determine which traces to save and which to discard:
- Head sampling — decides at the start of a trace whether to keep it or not
- Tail sampling — decides only after the complete trace is available. This is necessary when the decision depends on data that appears later in the trace. For example, data including error spans. These cases cannot be handled by head sampling since they require analyzing the entire trace first
\ The OpenTelemetry Collector helps configure the data collection system so that it will save only the necessary data. We will discuss its configuration later, but for now, let's move on to the question of what needs to be changed in the code so that it starts generating traces.
Zero-code instrumentationGetting trace generation really required minimal coding – it was just necessary to launch our applications with a java-agent, specifying the configuration:
\ -javaagent:/opentelemetry-javaagent-1.29.0.jar
-Dotel.javaagent.configuration-file=/otel-config.properties
\ OpenTelemetry supports a huge number of libraries and frameworks, so after launching the application with the agent, we immediately received traces with data on the stages of processing requests between services, in the DBMS, and so on.
\ In our agent configuration, we disabled the libraries we’re using whose spans we didn’t want to see in the traces, and to get data about how our code worked, we marked it with annotations:
\
@WithSpan("acquire locks") public CompletableFuture- Home
- About Us
- Write For Us / Submit Content
- Advertising And Affiliates
- Feeds And Syndication
- Contact Us
- Login
- Privacy
All Rights Reserved. Copyright , Central Coast Communications, Inc.


