and the distribution of digital products.
Image Compression Results, Evaluation of QoS System, and More
5.1 Image Compression Results
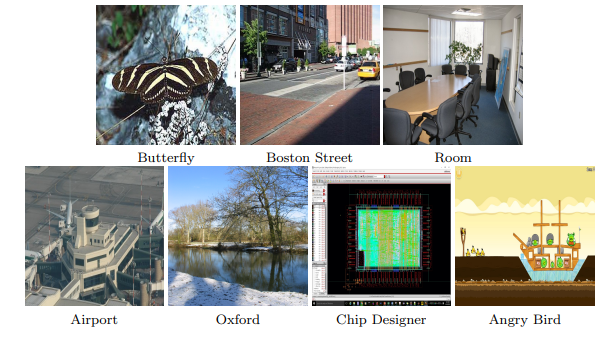
\ The proposed method was tested on some images in a dataset collected by the MIT Computer Science and Artificial Intelligence Lab. The natural images in the set include Zebra Butterfly (300×212, 27.4 kB), Boston Street (590×430, 069.2 kB), Conference Room (600 × 450, 61.4 kB), Airport (745 × 258, 46.2 kB), Oxford Outdoor (1526 × 2048, 1.21 MB), Chip Designer (1680 × 1050, 503 kB), and Angry Bird (1920 × 1080, 153 kB). All of the image compression programs were implemented in Matlab 2010 and executed on an Intel Core i5-4670 CPU running at 3.40 GHz.
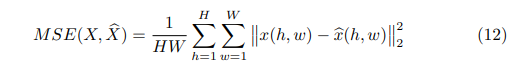
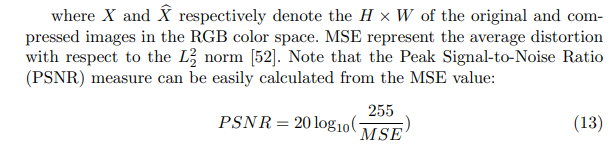
\ The effectiveness of the compression was quantified by the mean squared error (MSE) measure:
\
\
\
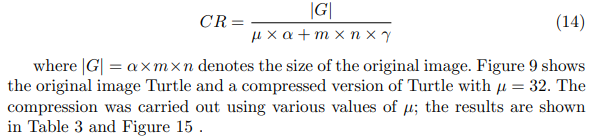
\ Let α denote the color depth, the image dimensions A(m × n), and let µ be defined as the number of colors (clusters) and γ as the number of bits necessary to represent the index of the colors at the location in the image. We computed the compression ratio (CR) by dividing the size of the original file in bits by the size of the compressed file:
\
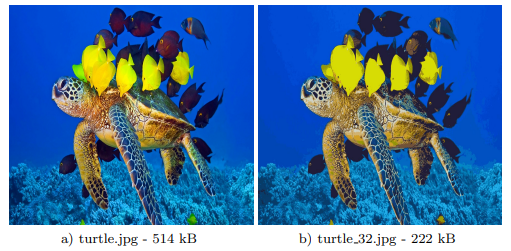
\ As can be seen, the presently proposed approach enabled compressing an image to 70% of its original size while maintaining 95% visual similarity to the original image. It is of extremely importance to reduce the frame loss rate when transmitting video data over the Internet. If the frame loss rate is small, it means that the video streaming quality is good.
\
\
\
\ 5.2 Evaluation of QoS System
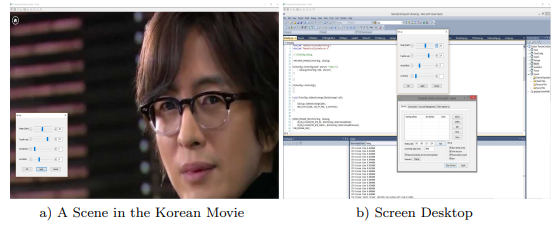
\ We built a testbed to carry out performance evaluations of the proposed system. Specifically, in the cloud environment, as a visualization platform we used an HP Server (4-core Intel Xeon CPU E3-1220 V2 running at 3.10 GHz, 32 GB RAM) with CentOS 6.5 and OpenStack (Icehouse version) [55] installed. Virtual machines (VMs) were installed with lightweight Windows. The VMs ran our server software, which was implemented in C/C++ using Microsoft Visual Studio 2010. We considered low-motion (Screen-Desktop) and highmotion (Korean Movie) videos for transmission Figure 11. For simplicity, we set up the environment to run two VMs and measured the frame loss rate during the transmission in two cases: with and without applying the QoS support system, for both video types. It was assumed that the client connected to the service side was a PC device, and the screen resolution and frame rate of all video sequences were SVGA (800 × 600) and 24 fps, respectively. Thus, the system predicted the best µ for each frame of desktop image data delivered.
\
\
D
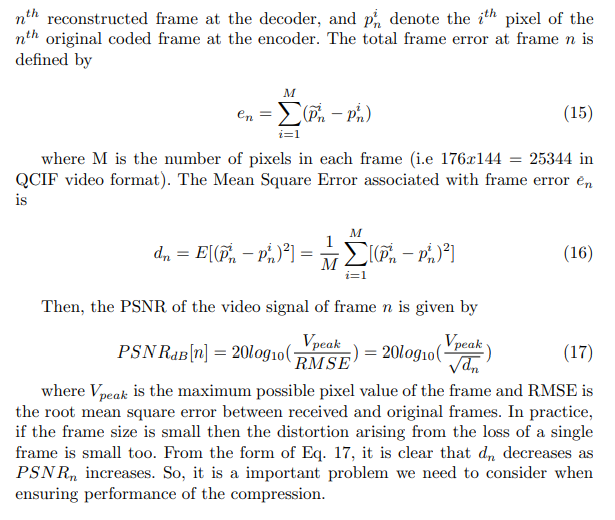
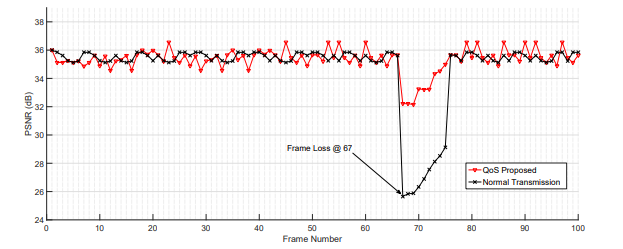
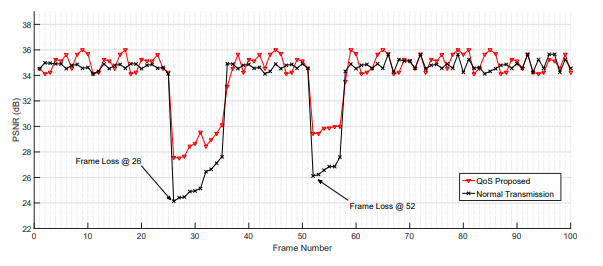
Figure 12 and 13 illustrate the changes that occur in the PSNR when a random single losses occurs during normal transmission and during transmission when the QoS support system is applied. These figures clearly demonstrate the distortion propagation for each type of video. Obviously, QoS policies can help the system to automatically adapt to the network condition. Specifically, the DDEM determines the suitable µ value. Then, the system automatically adjusts the size of the image to adapt the network status, mitigating the effects of the frame loss occurring at frame 63 in the low-motion video and at frames 26 and 52 in the high-motion videos while ensuring the highest possible quality.
\
\
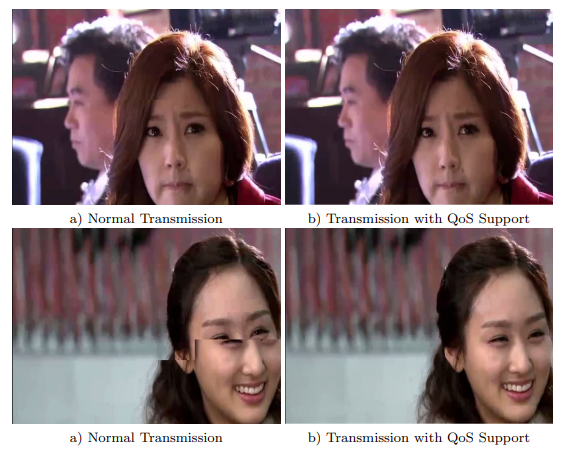
\ As shown in Figure 14 something mismatch for a slice area in the whole picture. This accounts for mismatch that some performed area in the picture is decoded by copying the data from previous key frame, but which cannot match the other part because the right reference data were lost.
\
\
:::info This paper is available on arxiv under CC BY 4.0 DEED license.
:::
:::info Authors:
(1) Huu-Quoc Nguyen, Department of Computer Engineering, Kyung Hee University, 1 Seocheon, Giheung, Yongin, Gyeonggi, South Korea and quoc@khu.ac.kr;
(2) Tien-Dung Nguyen, Department of Computer Engineering, Kyung Hee University, 1 Seocheon, Giheung, Yongin, Gyeonggi, South Korea and ntiendung@khu.ac.kr;
(3) Van-Nam Pham, Department of Computer Engineering, Kyung Hee University, 1 Seocheon, Giheung, Yongin, Gyeonggi, South Korea and nampv@khu.ac.kr;
(4) Xuan-Qui Pham, Department of Computer Engineering, Kyung Hee University, 1 Seocheon, Giheung, Yongin, Gyeonggi, South Korea and pxuanqui@khu.ac.kr;
(5) Quang-Thai Ngo, Department of Computer Engineering, Kyung Hee University, 1 Seocheon, Giheung, Yongin, Gyeonggi, South Korea and nqthai@khu.ac.kr;
(6) Eui-Nam Huh, Department of Computer Engineering, Kyung Hee University, 1 Seocheon, Giheung, Yongin, Gyeonggi, South Korea and johnhuh@khu.ac.kr.
:::
\