and the distribution of digital products.
The Graph Price target: Good entry point for swing trading
The Graph (GRT) is a decentralized indexing protocol designed to organize and make blockchain data easily accessible through subgraphs. GRT is the native token powering this ecosystem.
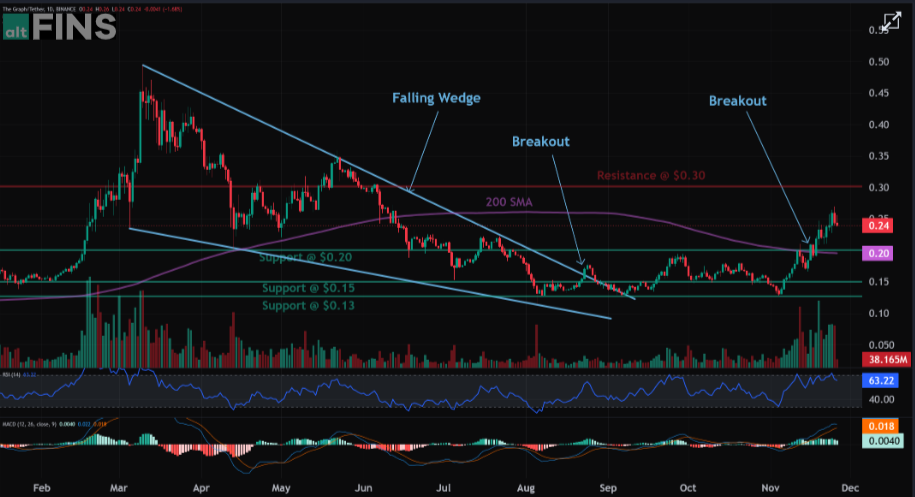
Resistance Breakout. Once a price breaks above a resistance zone, it signals that buyers have absorbed all the supply from sellers at this level and price can resume it’s advance. Following a resistance breakout, the next closest resistance zone becomes a price target.
Below is a detailed analysis of its current market trends and performance.
For on-demand analysis of any cryptocurrency, join our Telegram channel.
GRT Crypto Price Analysis- Current Price: $0.2340 (as of November 2024)
- Market Cap: $2.23 billion
- 24h Trading Volume: $213.76 million
- Circulating Supply: 9.54 billion GRT
- Total Supply: 10.79 billion GRT
- All-Time High: $2.84 (February 2021)
- All-Time Low: $0.0520 (November 2022).
 Img src- Altfins
Trends reversed to Uptrend following a bullish breakout from Falling Wedge pattern. Price broke above a stiff resistance area around $0.20 (also 200-day moving average), which signals resumption of uptrend, with +50% upside potential to $0.30 next. Stop loss at $0.16.
Buy Now Weekly Price Performance- Price Movement (24h): -8.62%
- Price Movement (7d): +1.82%
- 52-Week Range: $0.1121–$0.4963.
- Trend: Short-term trend is Strong Up, Medium-term trend is Strong Up, Long-term trend is Neutral.
- Momentum is Bullish but inflecting. MACD Line is still above MACD Signal Line but momentum may have peaked since MACD Histogram bars are declining, which suggests that momentum could be nearing a downswing.
- Support and Resistance: Nearest Support Zone is $0.15, then $0.13. Nearest Resistance Zone is $0.30.
- Market Dominance: Ranked #61 by market capitalization.
- Volatility: Daily price range between $0.2298 and $0.2575 in the last 24 hours.
- Year-to-Date Return: Approximately +12.96%.
UK Cryptocurrency Ownership Climbs to 12% in 2024: FCA
Ex-Binance Executives Launch Euro-Backed MiCA-Compliant Stablecoin
For on-demand analysis of any cryptocurrency, join our Telegram channel.
- Home
- About Us
- Write For Us / Submit Content
- Advertising And Affiliates
- Feeds And Syndication
- Contact Us
- Login
- Privacy
All Rights Reserved. Copyright , Central Coast Communications, Inc.