and the distribution of digital products.
Deep Syntax and Dead Founders: How AI Deciphered The Federalist Papers
:::info Authors:
(1) Todd K. Moon, Electrical and Computer Engineering Department, Utah State University, Logan, Utah;
(2) Jacob H. Gunther, Electrical and Computer Engineering Department, Utah State University, Logan, Utah.
:::
Table of LinksAbstract and 1 Introduction and Background
2 Statistical Parsing and Extracted Features
7 Conclusions, Discussion, and Future Work
A. A Brief Introduction to Statistical Parsing
B. Dimension Reduction: Some Mathematical Details
6 The Federalist PapersWith this background, we now turn attention to applying features derived from statistical parsing to two different sets of documents, the first being The Federalist Papers. The Federalist Papers consists of a series of 85 papers written around 1787 by Alexander Hamilton, James Madison, and John Jay in support of the U.S. Federal Constitution [30]. Of these papers, 51 are attributed unambiguously to Hamilton, 14 to Madison, 5 to Jay, and 3 to both Hamilton and Madison. The remaining twelve papers are of uncertain attribution, but are known to be by either Madison or Hamilton. In [7, 8], statistical techniques were used to determine that all twelve ambiguous papers were due to Madison.
\ The authors used in this study are {Hamilton, Madison, Jay, UncertainHorM, HandM}. A machine-readable copy of The Federalist Papers was obtained from the Gutenberg project [31]. Each of the 85 papers is considered a separate document, each of which is parsed into a separate file. Below we consider the performance of classifiers based on the feature vectors described above.
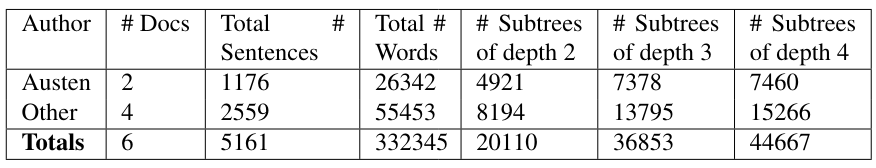
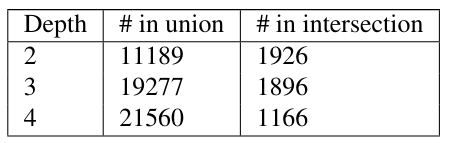
\ All Subtrees Subtree extraction is done on all trees for each of the Federalist papers. Table 3 shows the total number of sentences and words for each author considered. The table also shows the number of different subtrees at any level for the depths considered. The number of subtrees grows rapidly with the depth, leading to large feature vectors. Table 4 shows the number of subtrees in the union of the subtrees of all the authors and in the intersection of the subtrees of all the authors.
\ To form feature vectors using the subtree information, the top N subtrees (by count) for each author are selected (where we examined N = 5, 10, 20, and 30), then the union across authors was formed of these top subtrees. In the tables below, the number of subtrees in the union of the top N is denoted as “length(union)”. The fact that this number exceeds N indicates that not all authors have the same top N subtrees. This length(union) is m, the dimension of the feature vector used for classification before projection into a lower dimensional space.
\ The subtrees in the union of the top N form the row labels in a term-by-document matrix, where the terms (rows) are the subtrees and there is one column for each paper. This term-by-document is filled with counts for each subtree, then the term-by-document matrix is normalized so that each column sum is equal to 1. Classification was done by nearest distance to the class centroid, as described in section 4.
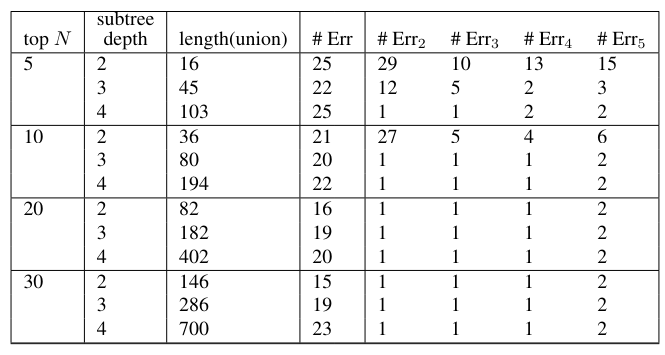
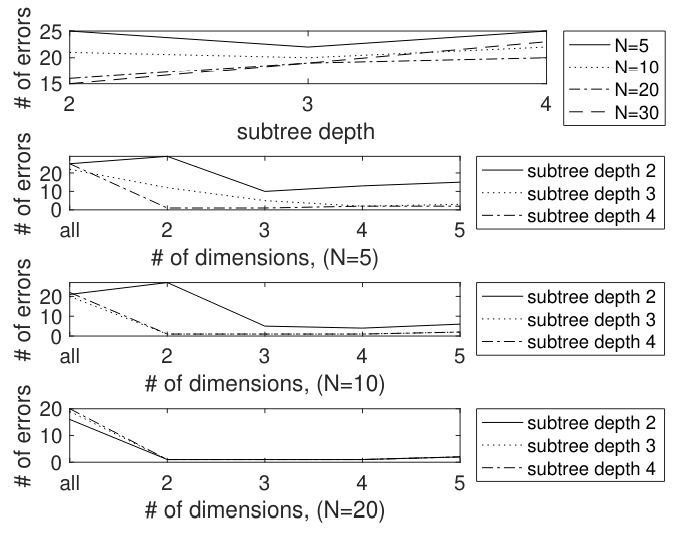
\ Classification results are shown in Table 5. The results (most of them) are also shown in figure 5. The test conditions are the number N (for the top N), the depth of the tree, and the dimension of the reduced dimension space ℓ. There is an error count in the column “# Err”, which is the number of errors (out of 85) using the original high-dimensional feature vectors. There are also error counts # Errℓ, for ℓ = 1, 2, 3, 4, 5, which are the number of errors for data projected in the ℓ-dimensional space as described in section 5. The # Err column never achieves a value less than 16, illustrating that the raw subtree features do not provide good classification. However, the reduced-dimension data can achieve good classification. For example, with top N = 5, subtrees of depth 4 achieve an error count of 1 for ℓ = 2 and ℓ = 3 dimensional projection. In fact, the error count is actually better than the table shows. For all error counts of 1, the one error that occurs is a classification of the author HandM as the author Madison. Since it is understood that the HandM papers were actually written by Madison, this is a correct classification.
\ There is clearly a broad “sweet spot” for these features. Taking the top N at least 10, a subtree depth of 3 or 4, and projected dimension of ℓ = 2, 3 or 4 provides the best performance. Interestingly, in all cases, moving to ℓ = 5 actually slightly increases the number of errors to 2.
\
\
\ These results indicate that the subtree feature does provide information which can distinguish authorship, with appropriate weighting of features and selection of the dimension.
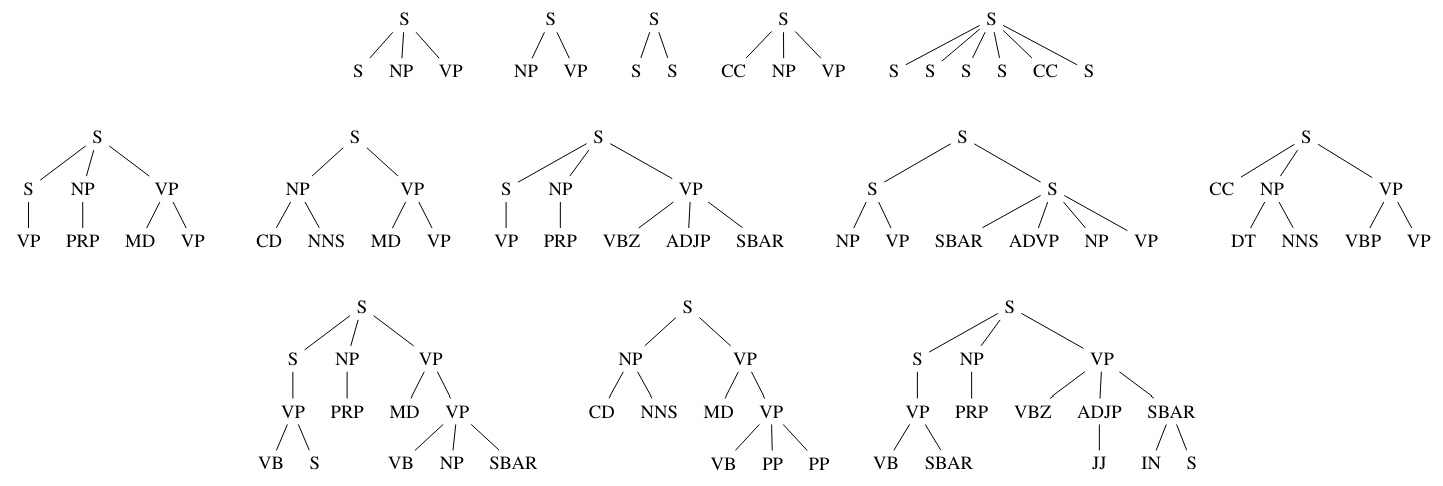
\ Rooted Subtrees We next considered using rooted subtrees as feature vectors. A few examples of these trees created from a Hamilton paper in the The Federalist Papers are shown in figure 6. There is quite a variety of possibilities (more than initially anticipated).
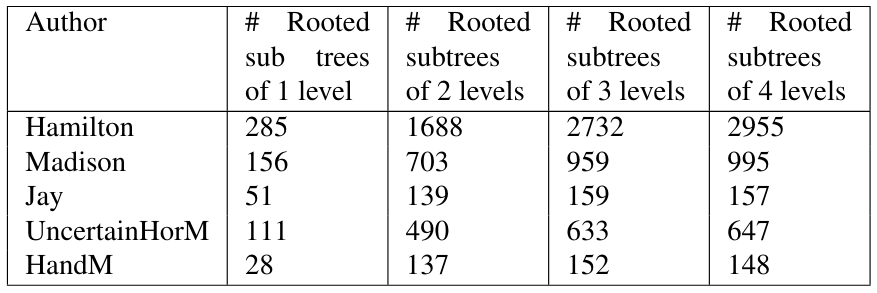
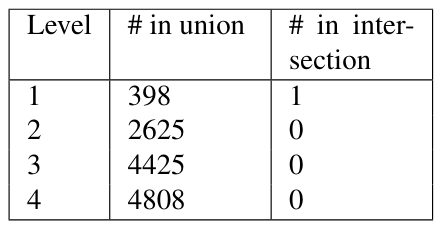
\ Some summary information about the number of different trees by author and level is shown in Table 6. Table 7 shows the number of rooted trees in the union of the trees across the authors, and the number of trees common to all authors (the intersection). There is so much variety in these trees that it is only at level 1 that there are any trees common to all authors, which is the tree S(NP)(VP), that is, a sentence with a noun phrase and a verb phrase.
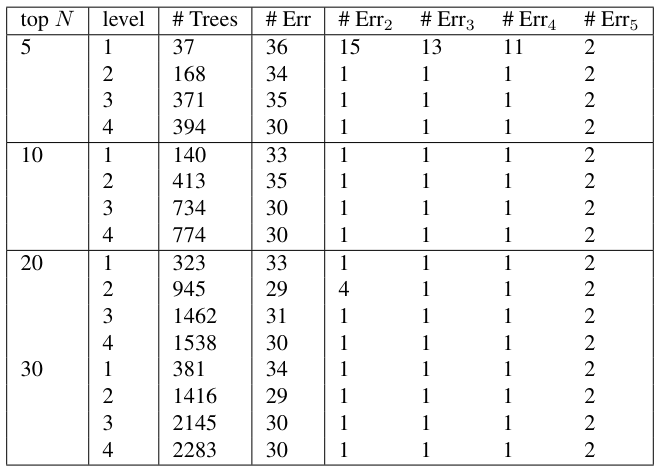
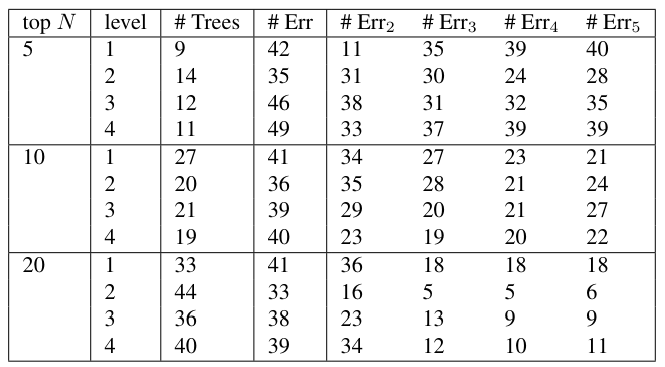
\ The feature vectors were formed as follows. For each level of rooted subtree, the top N trees for each author were selected, and the union of these trees across the documents formed the terms in a term-by-document matrix. The number of trees obtained is shown in the column # Trees of Table 8.
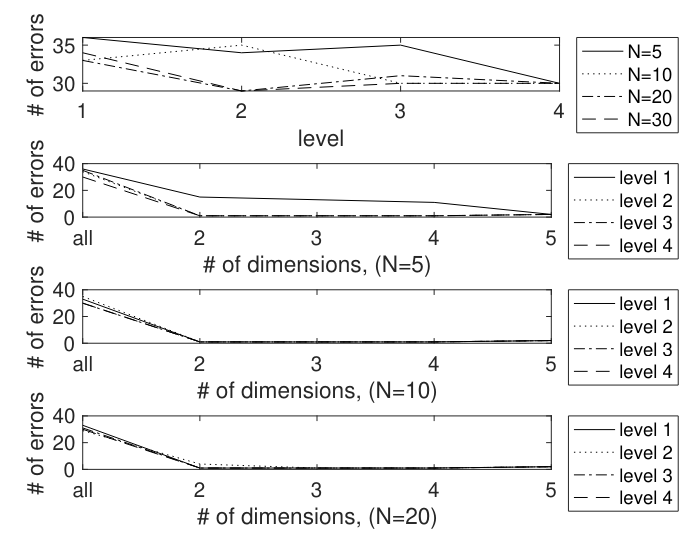
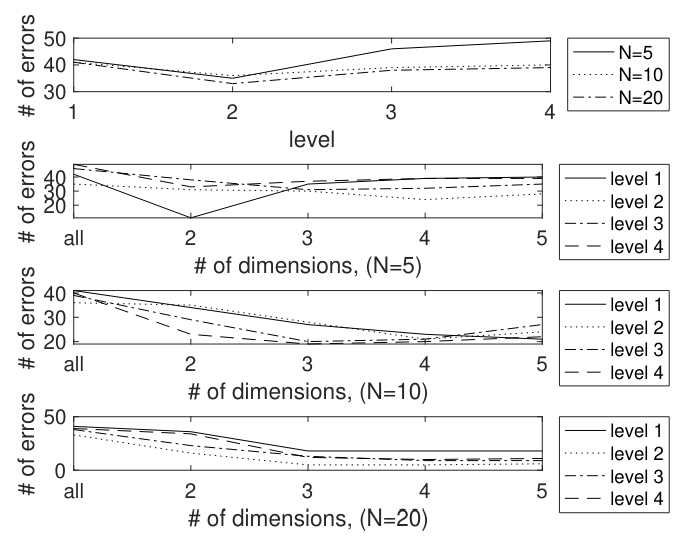
\ Incidence counts were formed for each document of each user. Classification was done by nearest distance to the class centroid, as described in section 4. This gave rather high error counts for each of the different levels. Then the data was projected into ℓ-dimensional space, and the error counts # Errℓ are computed. The results are shown in Table 8. The columns # Err, #Err2, . . . #Err5 show the number of errors for full dimension then 2-, . . . , 5-dimensional projections. Figure 7 graphically portrays the tabulated results.
\ As in the “all subtree” feature case, these low-dimensional projections do very well. In fact, as before, the error that occurs in the case that there is one error is when the HandM author was classified as the Madison author, which is in fact a correct classification.
\ The rooted subtrees features have a very broad sweet spot where good classification occurs. For dimensions ℓ = 2, 3 or 4, and at least 2 levels does very well. As for the all subtrees features, in this case also: for all error counts of 1, the one error that occurs is a classification of the author HandM as the author Madison. Since it is understood that the HandM papers were actually written by Madison, this is a correct classification, so all documents were correctly classified.
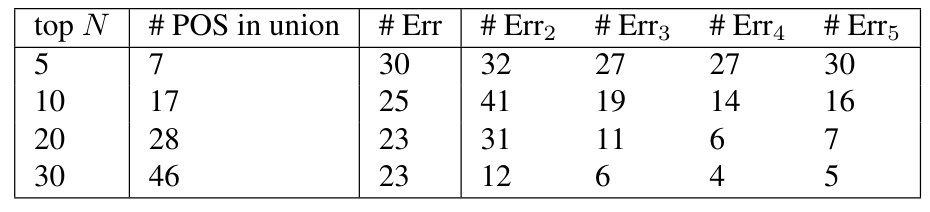
\ POS POS is a seemingly natural way to classify documents, but, contrary to expectations, it does not perform as well as the tree-based features. Feature vectors in this case are formed by taking the top N most common POS for each author, then forming the union of these POS. Feature vectors are formed by POS counts by author and document, normalized. Results are shown in Table 9. The raw error count for different values of N are all greater than or equal to 23. Moderate improvements can be obtained by projecting the feature vectors to lower dimensional space, with the errors for the ℓ-dimensional projection denoted by # Errℓ, for ℓ = 2, 3, 4, 5. Even in the best of circumstances, the error counts is equal to 4.
\ We conclude that while the POS provides a measure of distinguishability between authors, it does not provide the same degree of distinguishability as that provided by the structural information obtained from the parse trees.
\
\
\
\
\
\
\
\
\
\
\ POS by Level Table 10 shows the classification results for feature vectors obtained using the POS by level, using feature vectors formed in a manner similar to the other features. Figure 8 provides a graphical representation of this data. This feature vector provides some discrimination between authors, but fares substantially worse than the purely tree-based features.
\
:::info This paper is available on arxiv under CC BY 4.0 DEED license.
:::
\