and the distribution of digital products.
DM Television
Cardano (ADA) Uptrend Faces Hurdles: Will Bulls Break the Barrier?
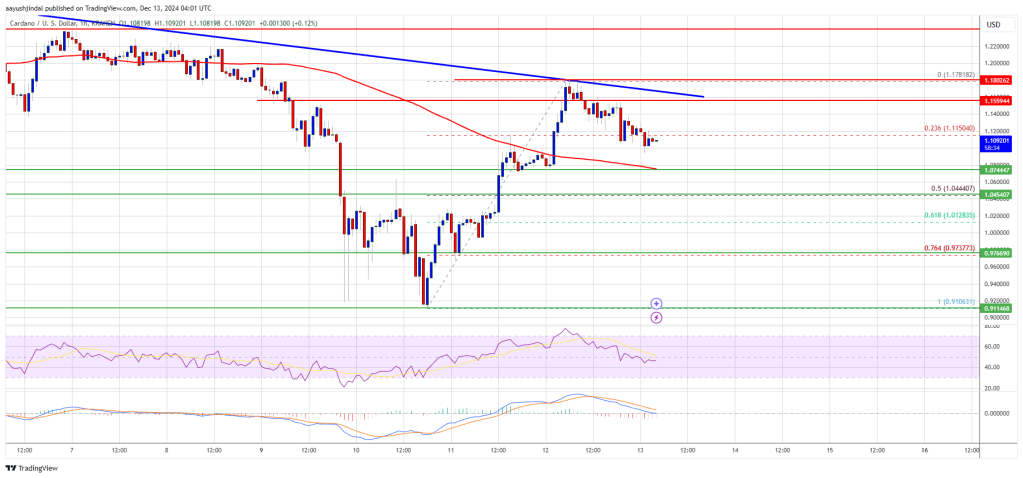
Cardano price started a downside correction from the $1.1780 zone. ADA is consolidating and facing hurdles near the $1.180 and $1.200 levels.
- ADA price started a decent increase from the $0.910 support zone.
- The price is trading above $1.050 and the 100-hourly simple moving average.
- There is a major bearish trend line forming with resistance at $1.160 on the hourly chart of the ADA/USD pair (data source from Kraken).
- The pair could start another increase if it clears the $1.180 resistance zone.
After forming a base above the $1.00 level, Cardano started a fresh increase like Bitcoin and Ethereum. ADA was able to climb above the $1.050 and $1.120 resistance levels.
However, the bears were active below the $1.20 level. A high was formed at $1.1781 and the price is now consolidating gains. There was a minor decline below the $1.120 level. The price dipped below the 23.6% Fib retracement level of the upward move from the $0.910 swing low to the $1.1781 high.
Cardano price is now trading above $1.050 and the 100-hourly simple moving average. On the upside, the price might face resistance near the $1.150 zone. There is also a major bearish trend line forming with resistance at $1.160 on the hourly chart of the ADA/USD pair.

The first resistance is near $1.180. The next key resistance might be $1.20. If there is a close above the $1.2 resistance, the price could start a strong rally. In the stated case, the price could rise toward the $1.2280 region. Any more gains might call for a move toward $1.250.
Another Decline in ADA?If Cardano’s price fails to climb above the $1.180 resistance level, it could start another decline. Immediate support on the downside is near the $1.10750 level.
The next major support is near the $1.050 level or the 50% Fib retracement level of the upward move from the $0.910 swing low to the $1.1781 high. A downside break below the $1.050 level could open the doors for a test of $1.00. The next major support is near the $0.920 level where the bulls might emerge.
Technical Indicators
Hourly MACD – The MACD for ADA/USD is gaining momentum in the bearish zone.
Hourly RSI (Relative Strength Index) – The RSI for ADA/USD is now below the 50 level.
Major Support Levels – $1.070 and $1.050.
Major Resistance Levels – $1.160 and $1.180.
- Home
- About Us
- Write For Us / Submit Content
- Advertising And Affiliates
- Feeds And Syndication
- Contact Us
- Login
- Privacy
All Rights Reserved. Copyright , Central Coast Communications, Inc.