and the distribution of digital products.
DM Television
Bitcoin Open Interest To Cap Ratio Hits 2-Year High, Cooldown Imminent?
Data shows the Bitcoin Open Interest to Market Cap Ratio has surged alongside the latest run in the asset’s price to the new all-time high (ATH).
Bitcoin Open Interest to Market Cap Ratio Is Now At A 2-Year HighAs explained by cryptocurrency news account Satoshi Club in an X post, the BTC Open Interest has been overheating relative to the Market Cap recently. The metric of interest here is the “Open Interest to Market Cap Ratio” from the market intelligence platform IntoTheBlock.
As its name suggests, this indicator tells us about how the Open Interest of Bitcoin compares against its Market Cap. The Open Interest refers to a measure of the total amount of derivatives positions related to BTC that are currently open on all exchanges.
Derivatives contracts are financial instruments that allow investors to bet on BTC’s price movements without necessarily owning any actual tokens. Because of this reason, the Open Interest is also sometimes called a measure of the ‘Paper’ BTC present in the sector.
The Market Cap is the total valuation of the cryptocurrency’s circulating supply at the current exchange rate, so the Open Interest to Market Cap Ratio basically tells us about how the volume of Paper BTC compares against the asset’s spot value.
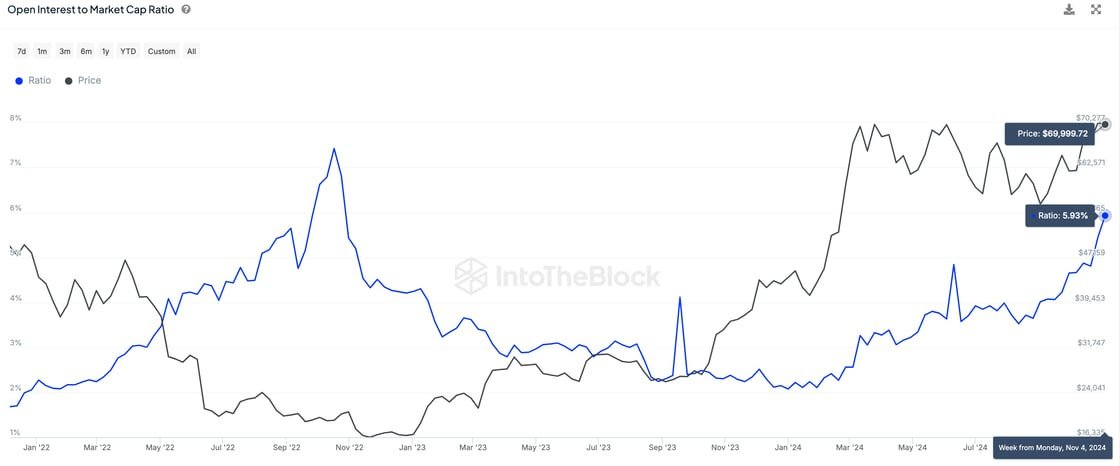
Now, here is a chart that shows the trend in this indicator for Bitcoin over the last few years:
As displayed in the above graph, the Bitcoin Open Interest to Market Cap Ratio has seen a sharp surge alongside the latest price rally that has taken the asset to a new all-time high (ATH).
This is an interesting trend, as the Market Cap going up should mean the ratio would head down instead as it’s in the denominator, so the fact that it has increased regardless implies paper BTC has simply been printed at a rate faster than the Market Cap has risen.
The indicator has now approached the 6% mark, which means there are now enough derivatives positions open to make up for 6% of the cryptocurrency’s total capitalization. This latest high in the metric is the highest that it has been since November 2022, when the collapse of the FTX exchange occurred.
Historically, the Open Interest to Market Cap Ratio being high hasn’t been a positive sign for BTC, as it implies there is an excess of leverage present in the sector.
The aforementioned high of November 2022 had led into a crash for the asset that would take it to the lowest point of the bear market. A similar cooldown had also occurred earlier in this year.
It now remains to be seen whether the Market Cap would be able to grow despite the overheated conditions brewing in the derivatives side, or if another mass leverage washout would follow for Bitcoin.
BTC PriceBitcoin is on the cusp of another record high as its price is floating around $76,300 right now.
- Home
- About Us
- Write For Us / Submit Content
- Advertising And Affiliates
- Feeds And Syndication
- Contact Us
- Login
- Privacy
All Rights Reserved. Copyright , Central Coast Communications, Inc.
