and the distribution of digital products.
Bitcoin Miners Dump $143 Million In 6 Days – A Sign Of Trouble?
Bitcoin is at a critical turning point after facing several days of selling pressure and consolidating above the $60,000 mark. While some analysts and investors are anticipating a massive rally in the coming months, key data indicates that the market may not be ready for a breakout just yet.
Recent on-chain data from CryptoQuant reveals that miners are offloading BTC, with their reserves showing a noticeable decline. This suggests that selling pressure from miners could be contributing to the current slowdown.
Despite the optimism for a future rally, the combination of recent price action and on-chain indicators implies that Bitcoin’s much-anticipated upward surge may still take time to materialize. As the crypto market remains uncertain, traders are watching closely for signs of whether the next move will be a bullish breakout or if further consolidation is ahead.
For now, BTC is holding steady, but all eyes are on whether it can maintain strength above $60,000 or if more selling pressure will emerge before the anticipated rally begins.
Bitcoin Miners Taking ProfitsBitcoin’s price action has faced downward pressure recently, driven by a series of selling events that pushed it down from local highs. Key data from CryptoQuant, shared by analyst Ali on X, highlights a significant trend involving Bitcoin miners. According to the data, Bitcoin miner reserves have decreased noticeably over the past few days. Miners sold a total of 2,364 BTC in the last six days, equating to roughly $143 million.
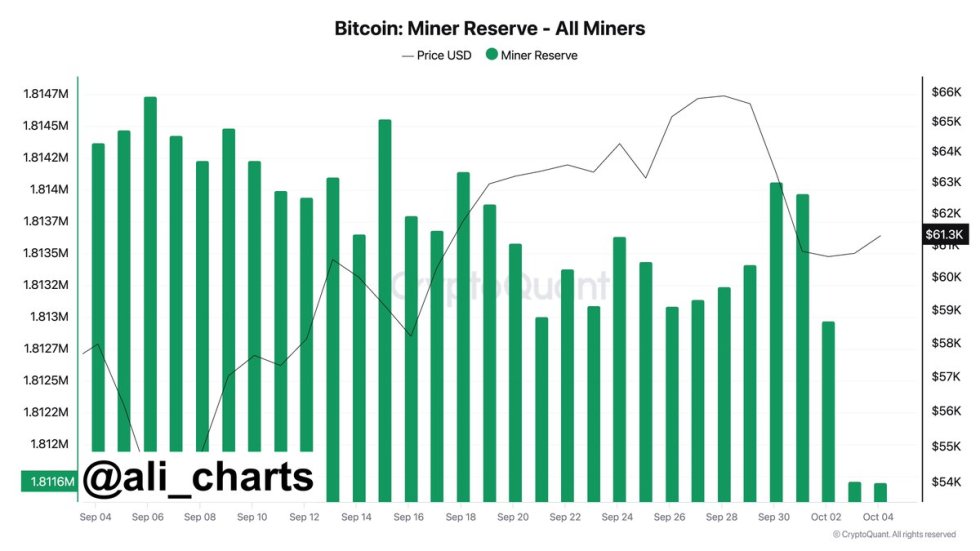
Miners’ sizable sell-off is a critical factor influencing Bitcoin’s current price dynamics. The behavior of miners often provides insight into broader market sentiment, and this recent selling spree suggests that miners may be preparing for a deeper correction. It’s possible they are taking profits after the recent rally or bracing for increased market volatility. The timing of these sales could indicate caution among miners and other big players in the market as they await Bitcoin’s next major move.
The latest price action, combined with these on-chain indicators, underscores the uncertainty surrounding Bitcoin’s short-term trajectory. Miners, known as significant market participants, seem to be playing it safe, which signals that the next few weeks could be pivotal for Bitcoin’s price. Investors are closely watching for further signs of consolidation or a potential breakout as the crypto market navigates this volatile period.
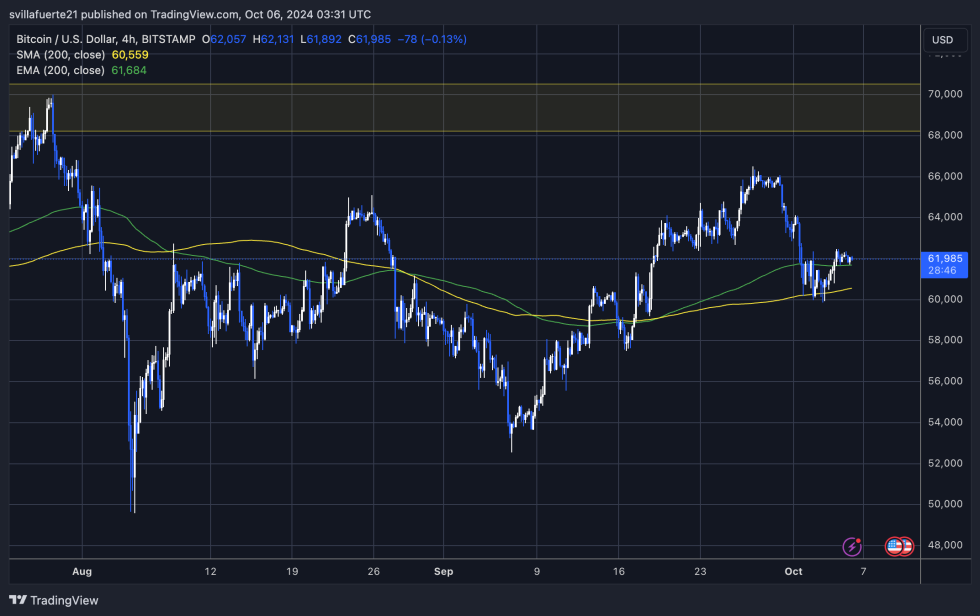
BTC Price Analysis: Holding Above $60,000Bitcoin is currently trading at $61,900, demonstrating strength as it holds above the crucial 4-hour 200 exponential moving average (EMA) at $61,684. Maintaining this level as support is vital for bullish momentum, as a successful push towards $66,000 could confirm the upward trend and open the door to new highs.
Analysts believe that if BTC can decisively break above this key resistance, it would signal a robust recovery and attract further buying interest. This could potentially drive the price to test even higher levels, reinforcing the positive sentiment surrounding the cryptocurrency.
Conversely, if BTC fails to maintain its position above the 4-hour 200 EMA, it could trigger a retracement to lower demand levels, with support anticipated around $57,500. A move below this level would raise concerns about the sustainability of the recent bullish action and might lead to increased selling pressure.
Traders are closely monitoring these price points, as they will determine Bitcoin’s short-term direction. The next few trading sessions will be crucial in establishing whether BTC can continue its bullish trajectory or face a correction back to lower demand zones.
Featured image from Dall-E, chart from TradingView