and the distribution of digital products.
36 Instagram statistics marketers need to know in 2025
Reaching two billion people every month, Instagram is a critical component of any brand’s digital marketing strategy. But it’s a tricky platform to pin down, since it’s known for algorithm changes and a constant influx of new or adjusted features.
Here, you’ll find an in-depth look at the most relevant and up-to-date Instagram stats so you can understand who’s using the platform now, what they’re looking for, and how you can best engage them.
But first…
What the data tells us (TL;DR)- Instagram is a global powerhouse with a young, engaged audience. With 2 billion monthly active users, it’s the third biggest social platform globally. Its demographic stats scream opportunity: 72% of U.S. teens and 76% of 18-29-year-olds are on it, making it the go-to spot for Gen Z. If your brand’s chasing younger audiences, this is your playground.
- Engagement’s solid, but strategy matters. The average overall engagement rate on the platform sits at 2.0%, with carousels crushing it at 2.4%. But less is more when it comes to posting. Some retailers post as many as 17 times a week, but it’s brands that update their feeds twice a week that see the best engagement, TL;DR? Quality over quantity, and lean into carousels.
- Instagram isn’t just fun — it’s a hub for shopping and search. Sure, 86% of users are there for entertainment, but 36% are using Instagram like Google, and 7% start their shopping searches there. With ad revenue projected at $67.27 billion in 2025 and 40.1% of Instagram shoppers already dropping over $200 a year, this platform’s a goldmine for ecommerce. Time to test those shopping features and explore Instagram SEO!
Instagram and WhatsApp both have 2,000,000,0000 active users worldwide as of April 2024. The most-used platform? Facebook, with more than 3 billion monthly active users.
2. Instagram also has the 4th most-visited website in the worldAccording to SimilarWeb, as of February 2025, Instagram.com is the fourth most-visited website globally, behind Google, YouTube, and Facebook. The average visit length is 8:38, which shows that people are using Instagram’s web presence to view content.
3. The most popular Instagram account is… @Instagram…with 685 million followers. Cristiano Ronaldo comes in a close second (649M), followed by Leo Messi (504M), Selena Gomez (421M), and Dwayne Johnson (394M).
4. Instagram has 2 billion active monthly usersThat’s about two-thirds of Facebook’s monthly active user base (3.065 billion).
Instagram benchmarks for marketers 5. The average engagement rate for Instagram is 2.0%However, this varies significantly by industry. Healthcare has the lowest engagement at 1.6%, with government having the highest (3.2%). Retail comes in at 1.8%
Not sure where you stand? Try our engagement rate calculator here.
 6. Carousels have the highest engagement rate at 2.4%
This is unchanged from last quarter, whereas Reels and photos both saw minor drops in engagement rate over that time.
 7. The average Instagram weekly follower growth rate was 14.7% in Q4 2024
However, that is a huge change from the previous quarter, when it was just 0.55%. This is likely a blip caused by concerns about the future of TikTok. The Q3 figure is a more realistic benchmark to target.
 8. The average Instagram posting frequency is 4.5 per week
That’s the lowest of the social media platforms examined in research by Hootsuite and Critical Truth. Keep in mind that this varies by industry, with retail brands posting the most at an average of 8.2 times per week.
 9. The optimum number of Instagram posts per week is 2
Brands may be posting more than they need to. Accounts that post 2x per week get the highest engagement. However, note that retail again is an exception. For consumer good retail, the optimum number of posts is a whopping 17.
 Instagram audience demographic stats
10. India has the most Instagram users: 362.9 million
Instagram audience demographic stats
10. India has the most Instagram users: 362.9 million
The United States is next with 169.6 million Instagram users. Brazil is third with 134.6 million. These statistics highlight that Instagram is a global channel with excellent potential for reaching international markets.
11. 72% of U.S. residents aged 15 to 17 use InstagramInstagram remains a valuable platform for reaching younger audiences. It’s actually the preferred platform for this age group, followed by TikTok at 68%.
12. 76% of U.S. adults aged 18-29 use InstagramThat’s the highest-use age group for the platform. 66% of U.S. adults ages 20-49 use the platform, followed by 26% of those ages 50-64 and 19% of those ages 65+.
13. 58% of Americans who earn more than $100k/year use InstagramThat’s the largest percentage of any income bracket. 54% of those who earn $70k-$99.9k use the platform, followed by 47% of those who earn $30k-$69.9k and 41% of those who earn less than $30k.
14. 55% of U.S. Instagram users are femaleAnd 45% are male. (These were the only gender options provided.)
15. Less than a third (32.2%) of Instagram users are aged 35 or olderAnd only 7.5% are aged 55 or older. You’re much more likely to reach Gen Z on the platform than Gen X or even older Millennials.

Source: Statista
16. Instagram is the preferred social network of U.S. internet users aged 13-28Despite all the TikTok hype, Instagram is the most-used social network for Generation Z.

Source: eMarketer
Instagram usage stats 17. 50% of U.S adults use InstagramThat puts it third behind YouTube and Facebook. For now, American adults still use Meta products much more than TikTok, Pinterest, and other platforms.

Source: Pew Research Center
18. 50% of U.S. teenagers use Instagram at least once a day12% of U.S. teens visit their Instagram profiles “almost constantly,” and 28% use it several times per day. Of note for marketers: More teens say they use Instagram daily than Snapchat, which is a change from last year.

Source: Pew Research
19. U.S. Instagram users spend an average of 16 minutes a day on the appUsers aged 18 to 24 spend the most time on the app, at 43 minutes per day. It goes down from there with every age increment, to just 3 minutes per day for those age 65+.

Source: eMarketer
20. 86% of U.S. Instagrammers use the platform because it’s entertaining
Source: Pew Research Center
That’s the most important reason people use the platform. This means your content had better be entertaining if you expect people to watch or engage. In our social media strategy guide, we recommend using 80% of your content to educate, inform, or entertain your audience.
21. 36% of people use Instagram as a search toolSpecifically, they say they search for information on Instagram the same way they would on Google. This represents a significant shift in Instagram use and makes it more important than ever for marketers to understand Instagram SEO.
22. 7% of U.S. consumers start their search on Instagram when online shoppingThe number of people who specifically use Instagram to start a shopping search is significantly lower than the number who use it to search for information. But this is still significant for marketers because these are people actively looking to buy a product. Facebook is the only social platform where more people begin their online shopping search (10%).
Bonus!!!Get our 2025 Social Media Trends report for the insights you need to reach your goals in what’s shaping up to be social’s best year yet.
Download now Instagram advertising stats 23. Instagram’s ad revenue will reach $67.27 billion in 2025Instagram ads rank second for revenue among all social platforms and fourth in the list of all companies with digital ad revenue (behind Google, Facebook, and Amazon).

Source: eMarketer
24. U.S. marketers will spend $2.56 billion on Instagram influencer marketing in 2024That’s more than double what they’ll spend on Facebook. And more U.S. marketers use Reels than TikTok for influencer marketing, according to eMarketer.
Instagram Stories stats 25. Instagram Stories have an average reach of 0.91 usersYes, the average Instagram Story is seen by less than one person. Compare that to 11 users per Reel and 7.8 users per carousel.
This is not shocking, given that Stories are generally only seen by your Instagram followers. Adam Mosseri said Stories should be considered as a subset of your Instagram presence to reach your most passionate fans.

Source: Statista
26. 71.9% of brand content on Instagram appears in StoriesThis is by far the most common type of brand content posted. In fact, Stories are the most used format on the platform overall, by a long shot. Accounts with a follower count of more than 50k post an average of 46 Stories per week.
Instagram Reels stats 27. Video accounts for more than 60% of the time people spend on InstagramYou need a solid Reels strategy to have the best chance of reaching your audience on the platform. Perhaps even more important in terms of getting your content to new audiences…
28. Reels are reshared more than 4.5 billion times per dayWith shares taking the lead as the most important engagement metric, that means engaging Reels are one of the best ways to connect with your audience and provide real value.
29. For Reels to be recommended to non-followers, they need to be less than 3 minutes longYou can still create longer Reels if your content justifies that, but know that they will not be recommended to non-followers.
Instagram statistics for business 30. The best time to post on Instagram varies significantly by day of the weekHootsuite’s original research with Critical Truth shows that the best time for Instagram business accounts to post for maximum engagement is a little too complicated to sum up in a single line. So, we’ve put it into this handy chart.

Keep in mind that this is overall data, and the best time to post can vary significantly by industry. We’ve got a whole blog post with the details for each industry. Or, use the Best Time to Publish feature in Hootsuite to get custom recommendations for your specific account.
31. The optimal number of hashtags on Instagram is 3 to 5The maximum number is 30, but that would be … a lot. We suggest using far fewer and making sure you also understand Instagram SEO.
32. Instagram ranks second for ROI confidenceAt least, that’s the case for marketers without a social listening strategy. For those that do have social listening in place, Instagram ties for ROI confidence with LinkedIn at 76%.

Source: Hootsuite Social Trends 2025 Report
33. 44% of U.S. Instagrammers use the app to look at product reviews or recommendationsFor marketers, this means you need to pay attention to what other people are saying about your brand. A social listening strategy can help. It’s also good motivation to seek out brand ambassadors and influencers who can share first-hand experiences of using your products or working with your company.
34. 40.1% of Instagram social shoppers spend more than $200/year on the platformThat’s significantly higher than on Facebook, Pinterest, or TikTok. It also ranks highest for people spending more than $700/year at 8.7%. However, note that TikTok has the highest percentage of people who spend $1000/year or more.

Source: eMarketer
35. Fashion brands are the top search category on Instagram (12%)11% of the total Instagram user base searches for hair and makeup, and 10% search for interior design. It’s a logical breakdown since this primarily visual platform works well to showcase design-oriented brands.
36. 37.3% of U.S. Instagram users will make purchases via the platform in 2025That puts it third for social platforms, behind TikTok and Facebook (but just barely).
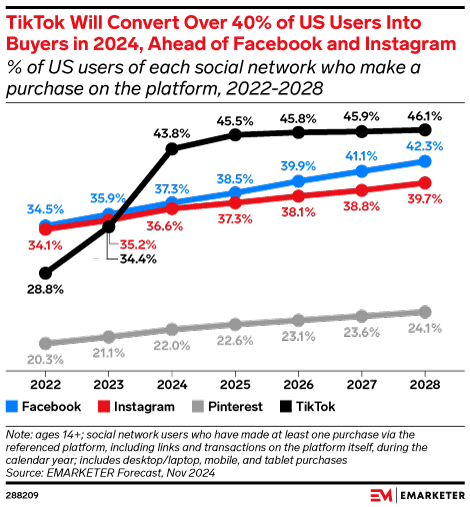
Source: eMarketer
How to use Instagram stats to inform your strategy 1. Analyze the Instagram demographics for a match with your target audienceBut go beyond the obvious. Half of all U.S. adults use the platform. There’s greater penetration in Gen Z than Gen X, but look beyond age to get a clearer picture of audience fit.
Consider that Instagram’s user base skews female, has a high income level, and is into fashion. These details can help you build an audience persona that helps guide your content strategy even if you’re not directly operating in the fashion space.
2. Benchmark your performance to identify strengths, weaknesses, and opportunitiesWe’ve included some benchmarking statistics in this post to give you a sense of what kinds of engagement rates and posting frequency you should aim for. To get more personalized insights to inform your strategy, dig into your specific Instagram account statistics as part of a competitive analysis.
Hootsuite’s benchmarking and competitive analysis tools give you the full picture of how your Instagram statistics stack up. You’ll even get recommendations on how to improve.
3. Lean into Instagram as an ecommerce toolThe ecommerce and social shopping statistics for Instagram are very promising. People are using this platform to search for and research products. And they’re putting their money where their searches are.
Yes, social media often functions best as a relationship-building tool rather than a direct conversion machine. But these statistics provide good motivation to at least test Instragram shopping features if you’re not already doing so.
4. Remember why people are thereThe number-one reason people use Instagram is because it’s entertaining. So ask yourself: Is your Instagram content entertaining? If there’s one thing you test this quarter, make it a stretch into more entertaining content.
Creative disruption is one of Hootsuite’s top social trends for 2025, and the Instagram statistics provide good reason to put it into action. Forty-three percent of brands have tried out a new tone of voice, personality, or persona on social in the last year. If you’re feeling nervous about venturing outside your usual brand guidelines, Instagram Stories provide a relatively safe testing ground since the content disappears after 24 hours.
Save time managing Instagram for business using Hootsuite. From a single dashboard, you can create, schedule and publish posts directly to Instagram, engage your audience, measure performance and run all your other social media profiles. Try it free today.
Get startedThe post 36 Instagram statistics marketers need to know in 2025 appeared first on Social Media Marketing & Management Dashboard.